Paiute vs Immigrants from India Unemployment Among Ages 16 to 19 years
COMPARE
Paiute
Immigrants from India
Unemployment Among Ages 16 to 19 years
Unemployment Among Ages 16 to 19 years Comparison
Paiute
Immigrants from India
24.4%
UNEMPLOYMENT AMONG AGES 16 TO 19 YEARS
0.0/ 100
METRIC RATING
333rd/ 347
METRIC RANK
15.0%
UNEMPLOYMENT AMONG AGES 16 TO 19 YEARS
100.0/ 100
METRIC RATING
2nd/ 347
METRIC RANK
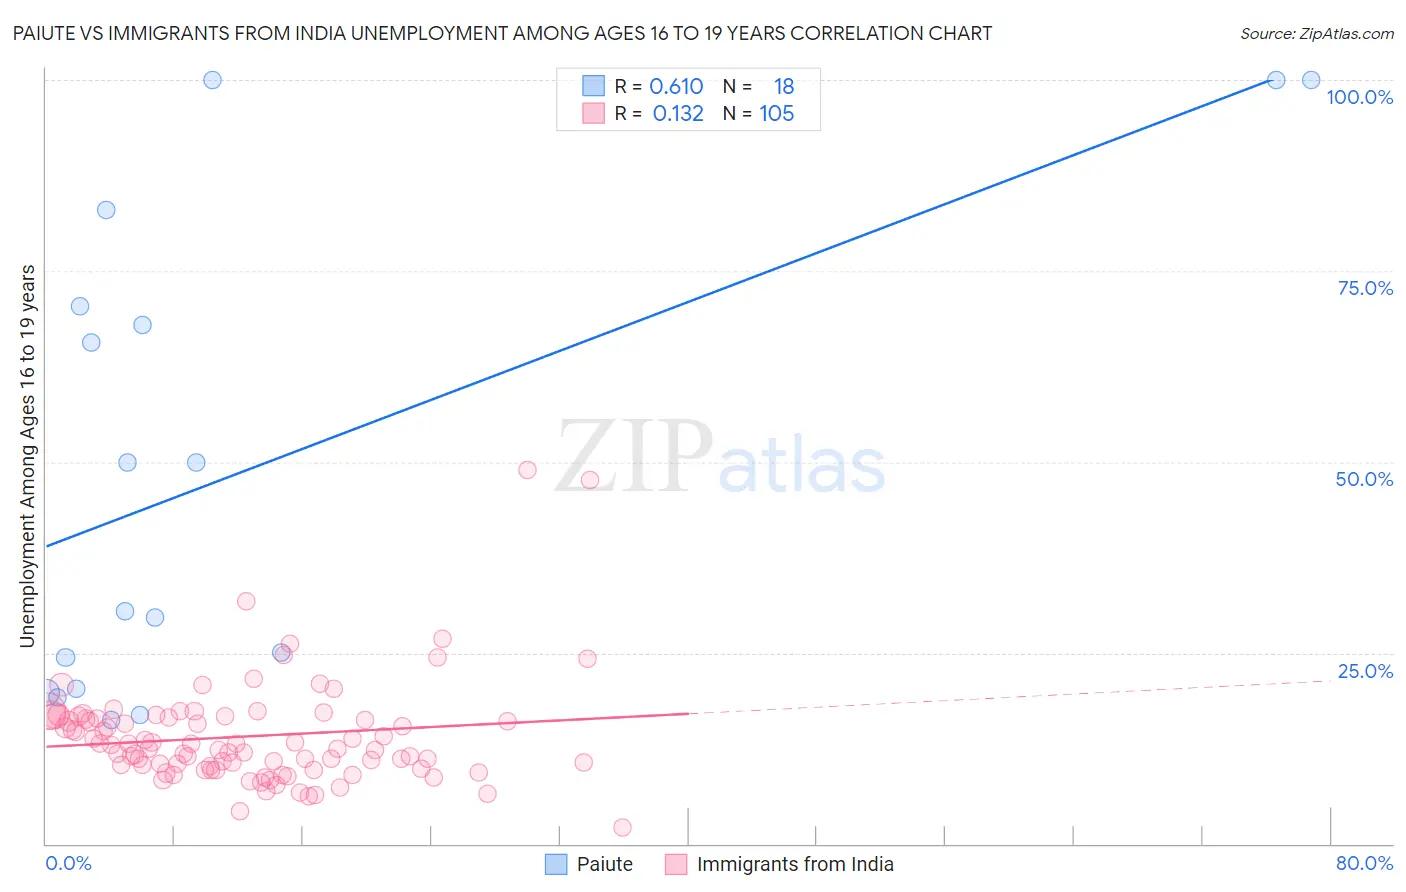
Paiute vs Immigrants from India Unemployment Among Ages 16 to 19 years Correlation Chart
The statistical analysis conducted on geographies consisting of 57,592,055 people shows a significant positive correlation between the proportion of Paiute and unemployment rate among population between the ages 16 and 19 in the United States with a correlation coefficient (R) of 0.610 and weighted average of 24.4%. Similarly, the statistical analysis conducted on geographies consisting of 409,890,327 people shows a poor positive correlation between the proportion of Immigrants from India and unemployment rate among population between the ages 16 and 19 in the United States with a correlation coefficient (R) of 0.132 and weighted average of 15.0%, a difference of 62.3%.
Unemployment Among Ages 16 to 19 years Correlation Summary
| Measurement | Paiute | Immigrants from India |
| Minimum | 16.3% | 2.2% |
| Maximum | 100.0% | 48.9% |
| Range | 83.7% | 46.7% |
| Mean | 49.4% | 14.0% |
| Median | 40.2% | 12.4% |
| Interquartile 25% (IQ1) | 20.3% | 10.0% |
| Interquartile 75% (IQ3) | 70.4% | 16.6% |
| Interquartile Range (IQR) | 50.0% | 6.6% |
| Standard Deviation (Sample) | 31.3% | 6.9% |
| Standard Deviation (Population) | 30.4% | 6.9% |
Similar Demographics by Unemployment Among Ages 16 to 19 years
Demographics Similar to Paiute by Unemployment Among Ages 16 to 19 years
In terms of unemployment among ages 16 to 19 years, the demographic groups most similar to Paiute are Immigrants from Barbados (24.0%, a difference of 1.4%), British West Indian (24.0%, a difference of 1.6%), Guyanese (24.8%, a difference of 1.9%), Dominican (23.6%, a difference of 3.0%), and Arapaho (25.2%, a difference of 3.3%).
| Demographics | Rating | Rank | Unemployment Among Ages 16 to 19 years |
| Immigrants | Trinidad and Tobago | 0.0 /100 | #326 | Tragic 23.1% |
| Pima | 0.0 /100 | #327 | Tragic 23.1% |
| Immigrants | Dominican Republic | 0.0 /100 | #328 | Tragic 23.3% |
| Tlingit-Haida | 0.0 /100 | #329 | Tragic 23.5% |
| Dominicans | 0.0 /100 | #330 | Tragic 23.6% |
| British West Indians | 0.0 /100 | #331 | Tragic 24.0% |
| Immigrants | Barbados | 0.0 /100 | #332 | Tragic 24.0% |
| Paiute | 0.0 /100 | #333 | Tragic 24.4% |
| Guyanese | 0.0 /100 | #334 | Tragic 24.8% |
| Arapaho | 0.0 /100 | #335 | Tragic 25.2% |
| Kiowa | 0.0 /100 | #336 | Tragic 25.2% |
| Immigrants | Guyana | 0.0 /100 | #337 | Tragic 25.5% |
| Immigrants | St. Vincent and the Grenadines | 0.0 /100 | #338 | Tragic 25.7% |
| Immigrants | Grenada | 0.0 /100 | #339 | Tragic 25.7% |
| Crow | 0.0 /100 | #340 | Tragic 26.2% |
Demographics Similar to Immigrants from India by Unemployment Among Ages 16 to 19 years
In terms of unemployment among ages 16 to 19 years, the demographic groups most similar to Immigrants from India are Luxembourger (15.1%, a difference of 0.42%), Danish (15.2%, a difference of 1.2%), Immigrants from Somalia (15.3%, a difference of 1.8%), Swedish (15.3%, a difference of 2.1%), and Immigrants from Bosnia and Herzegovina (15.3%, a difference of 2.2%).
| Demographics | Rating | Rank | Unemployment Among Ages 16 to 19 years |
| Norwegians | 100.0 /100 | #1 | Exceptional 14.5% |
| Immigrants | India | 100.0 /100 | #2 | Exceptional 15.0% |
| Luxembourgers | 100.0 /100 | #3 | Exceptional 15.1% |
| Danes | 100.0 /100 | #4 | Exceptional 15.2% |
| Immigrants | Somalia | 100.0 /100 | #5 | Exceptional 15.3% |
| Swedes | 100.0 /100 | #6 | Exceptional 15.3% |
| Immigrants | Bosnia and Herzegovina | 100.0 /100 | #7 | Exceptional 15.3% |
| Czechs | 100.0 /100 | #8 | Exceptional 15.4% |
| Scandinavians | 100.0 /100 | #9 | Exceptional 15.4% |
| Zimbabweans | 100.0 /100 | #10 | Exceptional 15.4% |
| Indonesians | 100.0 /100 | #11 | Exceptional 15.5% |
| Taiwanese | 100.0 /100 | #12 | Exceptional 15.5% |
| Immigrants | Burma/Myanmar | 100.0 /100 | #13 | Exceptional 15.6% |
| Immigrants | Zaire | 100.0 /100 | #14 | Exceptional 15.6% |
| Yugoslavians | 100.0 /100 | #15 | Exceptional 15.6% |