Swiss vs Immigrants from Burma/Myanmar Unemployment Among Ages 55 to 59 years
COMPARE
Swiss
Immigrants from Burma/Myanmar
Unemployment Among Ages 55 to 59 years
Unemployment Among Ages 55 to 59 years Comparison
Swiss
Immigrants from Burma/Myanmar
4.5%
UNEMPLOYMENT AMONG AGES 55 TO 59 YEARS
99.8/ 100
METRIC RATING
40th/ 347
METRIC RANK
4.4%
UNEMPLOYMENT AMONG AGES 55 TO 59 YEARS
100.0/ 100
METRIC RATING
22nd/ 347
METRIC RANK
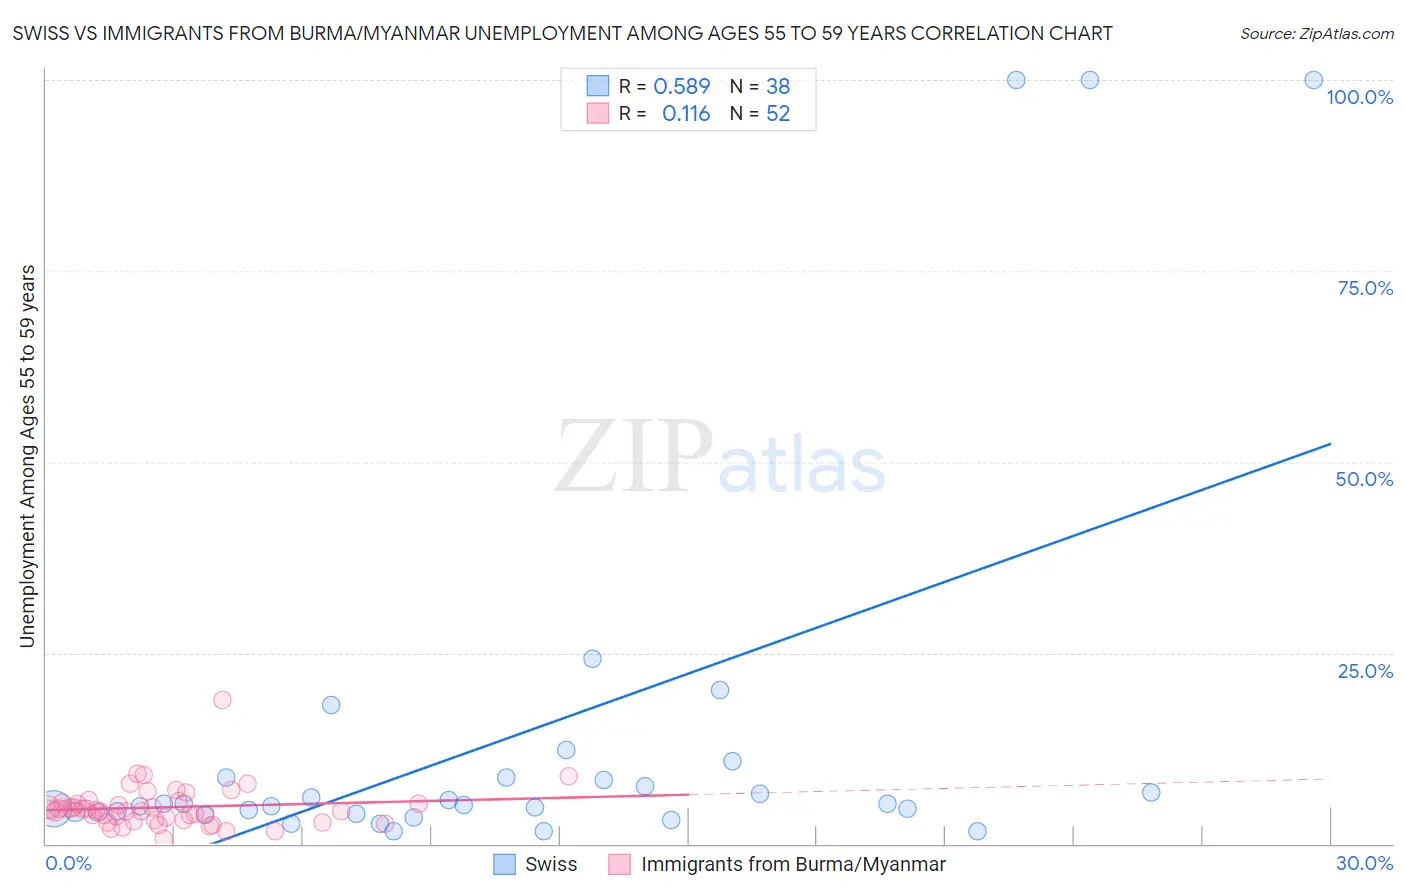
Swiss vs Immigrants from Burma/Myanmar Unemployment Among Ages 55 to 59 years Correlation Chart
The statistical analysis conducted on geographies consisting of 414,857,786 people shows a substantial positive correlation between the proportion of Swiss and unemployment rate among population between the ages 55 and 59 in the United States with a correlation coefficient (R) of 0.589 and weighted average of 4.5%. Similarly, the statistical analysis conducted on geographies consisting of 167,911,825 people shows a poor positive correlation between the proportion of Immigrants from Burma/Myanmar and unemployment rate among population between the ages 55 and 59 in the United States with a correlation coefficient (R) of 0.116 and weighted average of 4.4%, a difference of 2.1%.
Unemployment Among Ages 55 to 59 years Correlation Summary
| Measurement | Swiss | Immigrants from Burma/Myanmar |
| Minimum | 1.6% | 0.63% |
| Maximum | 100.0% | 18.8% |
| Range | 98.4% | 18.2% |
| Mean | 13.9% | 4.8% |
| Median | 5.1% | 4.3% |
| Interquartile 25% (IQ1) | 4.1% | 3.1% |
| Interquartile 75% (IQ3) | 8.7% | 5.3% |
| Interquartile Range (IQR) | 4.7% | 2.2% |
| Standard Deviation (Sample) | 26.0% | 2.8% |
| Standard Deviation (Population) | 25.7% | 2.7% |
Demographics Similar to Swiss and Immigrants from Burma/Myanmar by Unemployment Among Ages 55 to 59 years
In terms of unemployment among ages 55 to 59 years, the demographic groups most similar to Swiss are Luxembourger (4.5%, a difference of 0.010%), English (4.5%, a difference of 0.26%), Assyrian/Chaldean/Syriac (4.5%, a difference of 0.51%), Ethiopian (4.5%, a difference of 0.69%), and Immigrants from Bulgaria (4.5%, a difference of 0.69%). Similarly, the demographic groups most similar to Immigrants from Burma/Myanmar are Puget Sound Salish (4.4%, a difference of 0.090%), Kenyan (4.4%, a difference of 0.25%), Jordanian (4.4%, a difference of 0.54%), Immigrants from Eritrea (4.4%, a difference of 0.55%), and Scandinavian (4.5%, a difference of 0.72%).
| Demographics | Rating | Rank | Unemployment Among Ages 55 to 59 years |
| Puget Sound Salish | 100.0 /100 | #21 | Exceptional 4.4% |
| Immigrants | Burma/Myanmar | 100.0 /100 | #22 | Exceptional 4.4% |
| Kenyans | 100.0 /100 | #23 | Exceptional 4.4% |
| Jordanians | 100.0 /100 | #24 | Exceptional 4.4% |
| Immigrants | Eritrea | 100.0 /100 | #25 | Exceptional 4.4% |
| Scandinavians | 99.9 /100 | #26 | Exceptional 4.5% |
| Immigrants | Zimbabwe | 99.9 /100 | #27 | Exceptional 4.5% |
| Immigrants | Eastern Africa | 99.9 /100 | #28 | Exceptional 4.5% |
| Palestinians | 99.9 /100 | #29 | Exceptional 4.5% |
| Immigrants | Kenya | 99.9 /100 | #30 | Exceptional 4.5% |
| Germans | 99.9 /100 | #31 | Exceptional 4.5% |
| Immigrants | Ethiopia | 99.9 /100 | #32 | Exceptional 4.5% |
| Belgians | 99.9 /100 | #33 | Exceptional 4.5% |
| Thais | 99.9 /100 | #34 | Exceptional 4.5% |
| Cypriots | 99.9 /100 | #35 | Exceptional 4.5% |
| Ethiopians | 99.9 /100 | #36 | Exceptional 4.5% |
| Immigrants | Bulgaria | 99.9 /100 | #37 | Exceptional 4.5% |
| Assyrians/Chaldeans/Syriacs | 99.9 /100 | #38 | Exceptional 4.5% |
| English | 99.9 /100 | #39 | Exceptional 4.5% |
| Swiss | 99.8 /100 | #40 | Exceptional 4.5% |
| Luxembourgers | 99.8 /100 | #41 | Exceptional 4.5% |