Immigrants from Middle Africa vs Immigrants from Burma/Myanmar Unemployment Among Ages 55 to 59 years
COMPARE
Immigrants from Middle Africa
Immigrants from Burma/Myanmar
Unemployment Among Ages 55 to 59 years
Unemployment Among Ages 55 to 59 years Comparison
Immigrants from Middle Africa
Immigrants from Burma/Myanmar
4.5%
UNEMPLOYMENT AMONG AGES 55 TO 59 YEARS
99.7/ 100
METRIC RATING
53rd/ 347
METRIC RANK
4.4%
UNEMPLOYMENT AMONG AGES 55 TO 59 YEARS
100.0/ 100
METRIC RATING
22nd/ 347
METRIC RANK
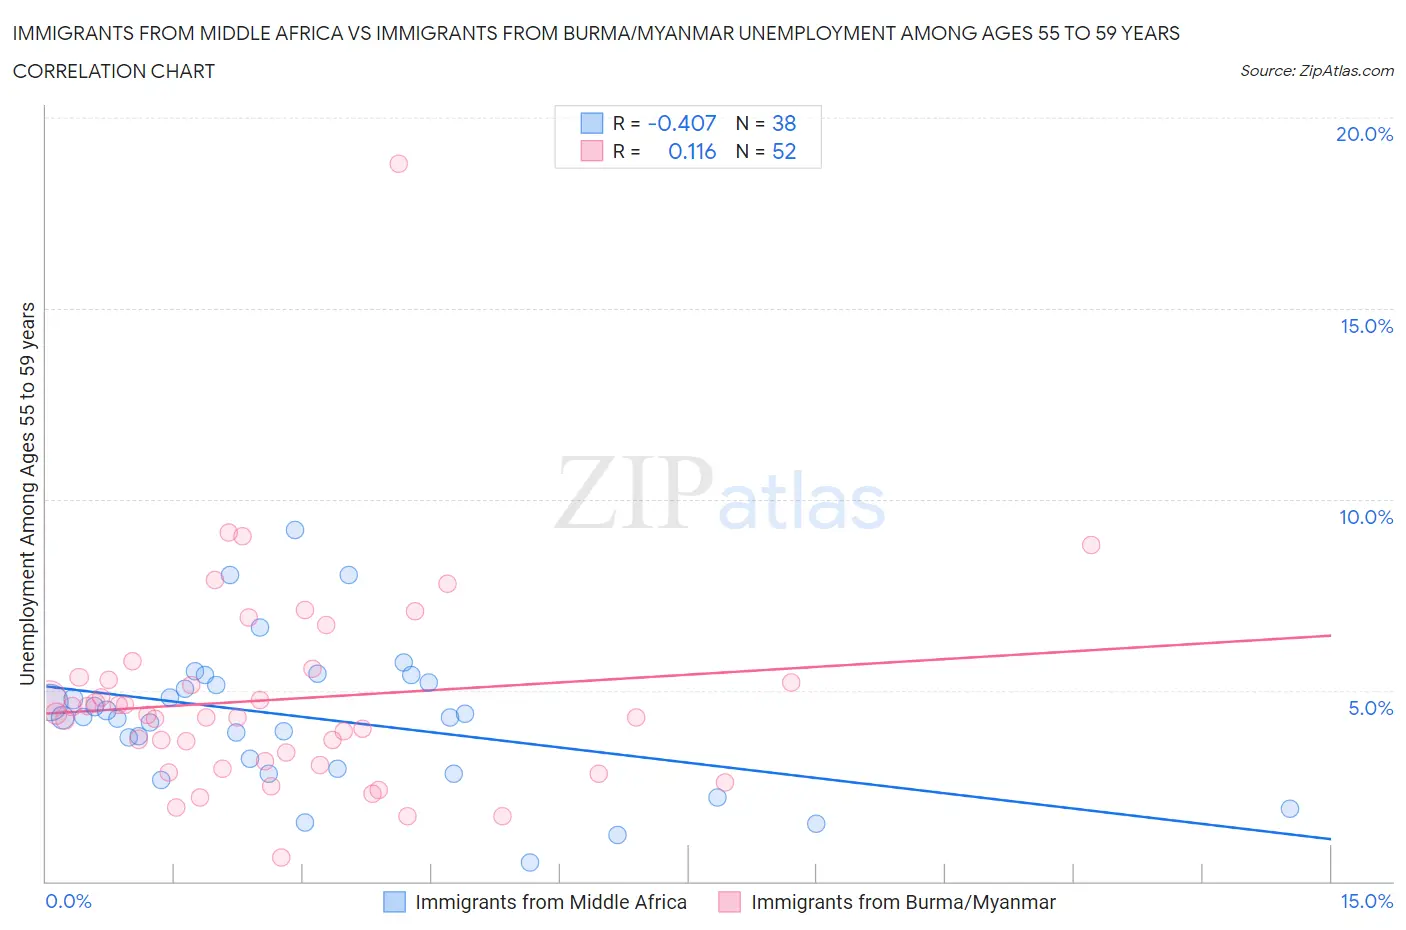
Immigrants from Middle Africa vs Immigrants from Burma/Myanmar Unemployment Among Ages 55 to 59 years Correlation Chart
The statistical analysis conducted on geographies consisting of 195,539,483 people shows a moderate negative correlation between the proportion of Immigrants from Middle Africa and unemployment rate among population between the ages 55 and 59 in the United States with a correlation coefficient (R) of -0.407 and weighted average of 4.5%. Similarly, the statistical analysis conducted on geographies consisting of 167,911,825 people shows a poor positive correlation between the proportion of Immigrants from Burma/Myanmar and unemployment rate among population between the ages 55 and 59 in the United States with a correlation coefficient (R) of 0.116 and weighted average of 4.4%, a difference of 2.7%.
Unemployment Among Ages 55 to 59 years Correlation Summary
| Measurement | Immigrants from Middle Africa | Immigrants from Burma/Myanmar |
| Minimum | 0.50% | 0.63% |
| Maximum | 9.2% | 18.8% |
| Range | 8.7% | 18.2% |
| Mean | 4.3% | 4.8% |
| Median | 4.3% | 4.3% |
| Interquartile 25% (IQ1) | 2.9% | 3.1% |
| Interquartile 75% (IQ3) | 5.2% | 5.3% |
| Interquartile Range (IQR) | 2.3% | 2.2% |
| Standard Deviation (Sample) | 1.9% | 2.8% |
| Standard Deviation (Population) | 1.8% | 2.7% |
Similar Demographics by Unemployment Among Ages 55 to 59 years
Demographics Similar to Immigrants from Middle Africa by Unemployment Among Ages 55 to 59 years
In terms of unemployment among ages 55 to 59 years, the demographic groups most similar to Immigrants from Middle Africa are Burmese (4.5%, a difference of 0.0%), Scottish (4.5%, a difference of 0.010%), Immigrants from Nepal (4.5%, a difference of 0.10%), Maltese (4.5%, a difference of 0.12%), and Immigrants from Pakistan (4.5%, a difference of 0.15%).
| Demographics | Rating | Rank | Unemployment Among Ages 55 to 59 years |
| Immigrants | Zaire | 99.8 /100 | #46 | Exceptional 4.5% |
| German Russians | 99.8 /100 | #47 | Exceptional 4.5% |
| Immigrants | Moldova | 99.7 /100 | #48 | Exceptional 4.5% |
| Immigrants | Saudi Arabia | 99.7 /100 | #49 | Exceptional 4.5% |
| Immigrants | Pakistan | 99.7 /100 | #50 | Exceptional 4.5% |
| Maltese | 99.7 /100 | #51 | Exceptional 4.5% |
| Scottish | 99.7 /100 | #52 | Exceptional 4.5% |
| Immigrants | Middle Africa | 99.7 /100 | #53 | Exceptional 4.5% |
| Burmese | 99.7 /100 | #54 | Exceptional 4.5% |
| Immigrants | Nepal | 99.6 /100 | #55 | Exceptional 4.5% |
| Welsh | 99.6 /100 | #56 | Exceptional 4.5% |
| Northern Europeans | 99.6 /100 | #57 | Exceptional 4.5% |
| Okinawans | 99.6 /100 | #58 | Exceptional 4.5% |
| Immigrants | Uganda | 99.5 /100 | #59 | Exceptional 4.6% |
| Dutch | 99.5 /100 | #60 | Exceptional 4.6% |
Demographics Similar to Immigrants from Burma/Myanmar by Unemployment Among Ages 55 to 59 years
In terms of unemployment among ages 55 to 59 years, the demographic groups most similar to Immigrants from Burma/Myanmar are Puget Sound Salish (4.4%, a difference of 0.090%), Swedish (4.4%, a difference of 0.24%), Kenyan (4.4%, a difference of 0.25%), Chinese (4.4%, a difference of 0.37%), and Immigrants from Somalia (4.4%, a difference of 0.46%).
| Demographics | Rating | Rank | Unemployment Among Ages 55 to 59 years |
| Bulgarians | 100.0 /100 | #15 | Exceptional 4.3% |
| Somalis | 100.0 /100 | #16 | Exceptional 4.4% |
| Czechs | 100.0 /100 | #17 | Exceptional 4.4% |
| Immigrants | Somalia | 100.0 /100 | #18 | Exceptional 4.4% |
| Chinese | 100.0 /100 | #19 | Exceptional 4.4% |
| Swedes | 100.0 /100 | #20 | Exceptional 4.4% |
| Puget Sound Salish | 100.0 /100 | #21 | Exceptional 4.4% |
| Immigrants | Burma/Myanmar | 100.0 /100 | #22 | Exceptional 4.4% |
| Kenyans | 100.0 /100 | #23 | Exceptional 4.4% |
| Jordanians | 100.0 /100 | #24 | Exceptional 4.4% |
| Immigrants | Eritrea | 100.0 /100 | #25 | Exceptional 4.4% |
| Scandinavians | 99.9 /100 | #26 | Exceptional 4.5% |
| Immigrants | Zimbabwe | 99.9 /100 | #27 | Exceptional 4.5% |
| Immigrants | Eastern Africa | 99.9 /100 | #28 | Exceptional 4.5% |
| Palestinians | 99.9 /100 | #29 | Exceptional 4.5% |