Swiss vs Swedish Unemployment Among Women with Children Under 6 years
COMPARE
Swiss
Swedish
Unemployment Among Women with Children Under 6 years
Unemployment Among Women with Children Under 6 years Comparison
Swiss
Swedes
7.9%
UNEMPLOYMENT AMONG WOMEN WITH CHILDREN UNDER 6 YEARS
12.3/ 100
METRIC RATING
212th/ 347
METRIC RANK
7.4%
UNEMPLOYMENT AMONG WOMEN WITH CHILDREN UNDER 6 YEARS
88.4/ 100
METRIC RATING
130th/ 347
METRIC RANK
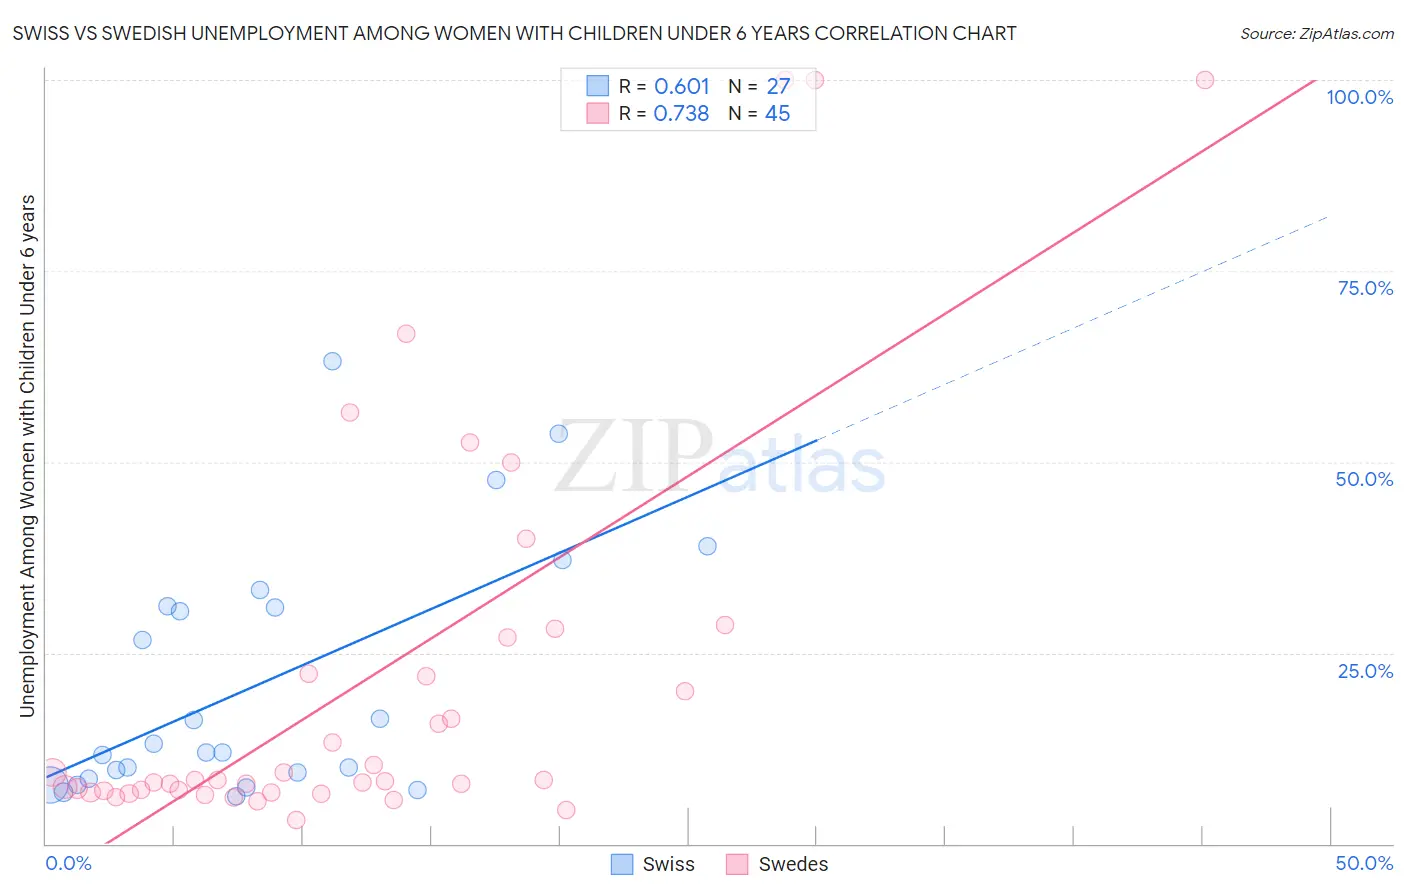
Swiss vs Swedish Unemployment Among Women with Children Under 6 years Correlation Chart
The statistical analysis conducted on geographies consisting of 326,858,095 people shows a significant positive correlation between the proportion of Swiss and unemployment rate among women with children under the age of 6 in the United States with a correlation coefficient (R) of 0.601 and weighted average of 7.9%. Similarly, the statistical analysis conducted on geographies consisting of 362,245,772 people shows a strong positive correlation between the proportion of Swedes and unemployment rate among women with children under the age of 6 in the United States with a correlation coefficient (R) of 0.738 and weighted average of 7.4%, a difference of 6.9%.
Unemployment Among Women with Children Under 6 years Correlation Summary
| Measurement | Swiss | Swedish |
| Minimum | 6.2% | 3.1% |
| Maximum | 63.2% | 100.0% |
| Range | 57.1% | 96.9% |
| Mean | 20.9% | 21.3% |
| Median | 12.0% | 8.4% |
| Interquartile 25% (IQ1) | 8.5% | 6.8% |
| Interquartile 75% (IQ3) | 31.1% | 24.6% |
| Interquartile Range (IQR) | 22.6% | 17.8% |
| Standard Deviation (Sample) | 16.2% | 26.1% |
| Standard Deviation (Population) | 15.9% | 25.8% |
Similar Demographics by Unemployment Among Women with Children Under 6 years
Demographics Similar to Swiss by Unemployment Among Women with Children Under 6 years
In terms of unemployment among women with children under 6 years, the demographic groups most similar to Swiss are Scottish (7.9%, a difference of 0.13%), Spanish (7.9%, a difference of 0.16%), Ecuadorian (7.9%, a difference of 0.17%), Immigrants from Lebanon (7.9%, a difference of 0.19%), and Immigrants from Nigeria (7.9%, a difference of 0.31%).
| Demographics | Rating | Rank | Unemployment Among Women with Children Under 6 years |
| Immigrants | Immigrants | 21.4 /100 | #205 | Fair 7.8% |
| Hungarians | 21.2 /100 | #206 | Fair 7.8% |
| Canadians | 20.6 /100 | #207 | Fair 7.8% |
| Immigrants | Syria | 18.9 /100 | #208 | Poor 7.8% |
| Costa Ricans | 17.6 /100 | #209 | Poor 7.8% |
| Poles | 16.0 /100 | #210 | Poor 7.9% |
| Immigrants | Ecuador | 14.9 /100 | #211 | Poor 7.9% |
| Swiss | 12.3 /100 | #212 | Poor 7.9% |
| Scottish | 11.4 /100 | #213 | Poor 7.9% |
| Spanish | 11.3 /100 | #214 | Poor 7.9% |
| Ecuadorians | 11.2 /100 | #215 | Poor 7.9% |
| Immigrants | Lebanon | 11.1 /100 | #216 | Poor 7.9% |
| Immigrants | Nigeria | 10.3 /100 | #217 | Poor 7.9% |
| Moroccans | 9.7 /100 | #218 | Tragic 7.9% |
| Arabs | 9.4 /100 | #219 | Tragic 7.9% |
Demographics Similar to Swedes by Unemployment Among Women with Children Under 6 years
In terms of unemployment among women with children under 6 years, the demographic groups most similar to Swedes are Ukrainian (7.4%, a difference of 0.040%), Slovene (7.4%, a difference of 0.14%), Immigrants from Armenia (7.4%, a difference of 0.17%), Immigrants from Uganda (7.4%, a difference of 0.29%), and Immigrants from Bolivia (7.4%, a difference of 0.40%).
| Demographics | Rating | Rank | Unemployment Among Women with Children Under 6 years |
| Immigrants | Zaire | 93.3 /100 | #123 | Exceptional 7.3% |
| Immigrants | South Africa | 92.5 /100 | #124 | Exceptional 7.3% |
| Pakistanis | 92.2 /100 | #125 | Exceptional 7.3% |
| Immigrants | Burma/Myanmar | 91.9 /100 | #126 | Exceptional 7.3% |
| Jordanians | 91.5 /100 | #127 | Exceptional 7.3% |
| Zimbabweans | 91.5 /100 | #128 | Exceptional 7.3% |
| Slovenes | 89.2 /100 | #129 | Excellent 7.4% |
| Swedes | 88.4 /100 | #130 | Excellent 7.4% |
| Ukrainians | 88.2 /100 | #131 | Excellent 7.4% |
| Immigrants | Armenia | 87.4 /100 | #132 | Excellent 7.4% |
| Immigrants | Uganda | 86.5 /100 | #133 | Excellent 7.4% |
| Immigrants | Bolivia | 85.7 /100 | #134 | Excellent 7.4% |
| Immigrants | Northern Africa | 85.3 /100 | #135 | Excellent 7.4% |
| Immigrants | Morocco | 84.9 /100 | #136 | Excellent 7.4% |
| Immigrants | Cambodia | 84.6 /100 | #137 | Excellent 7.4% |