Immigrants from Malaysia vs Argentinean Unemployment Among Women with Children Under 6 years
COMPARE
Immigrants from Malaysia
Argentinean
Unemployment Among Women with Children Under 6 years
Unemployment Among Women with Children Under 6 years Comparison
Immigrants from Malaysia
Argentineans
6.4%
UNEMPLOYMENT AMONG WOMEN WITH CHILDREN UNDER 6 YEARS
100.0/ 100
METRIC RATING
17th/ 347
METRIC RANK
7.2%
UNEMPLOYMENT AMONG WOMEN WITH CHILDREN UNDER 6 YEARS
96.2/ 100
METRIC RATING
114th/ 347
METRIC RANK
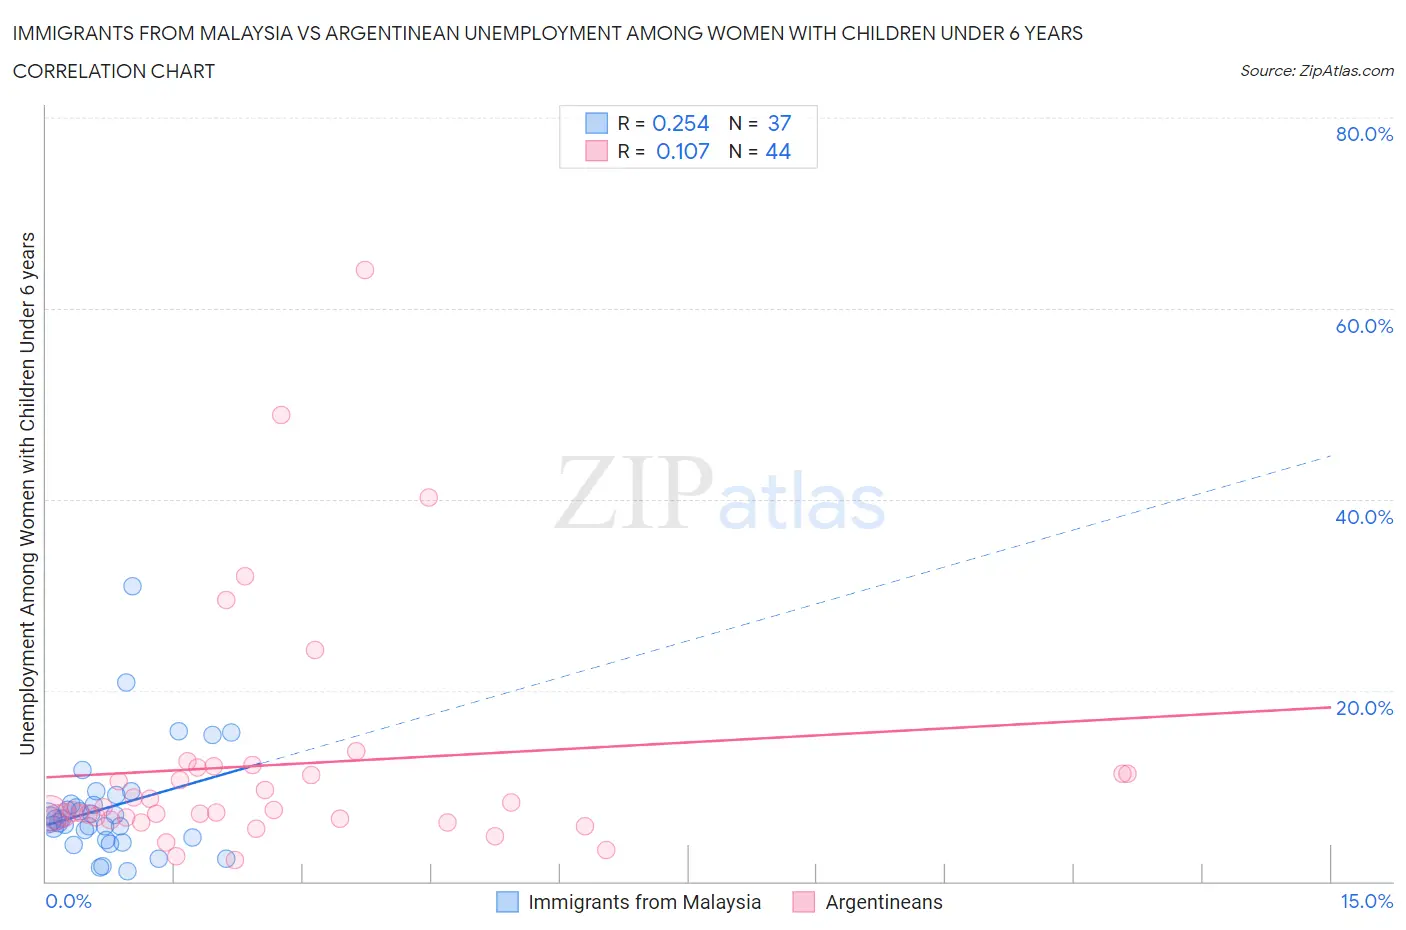
Immigrants from Malaysia vs Argentinean Unemployment Among Women with Children Under 6 years Correlation Chart
The statistical analysis conducted on geographies consisting of 169,871,997 people shows a weak positive correlation between the proportion of Immigrants from Malaysia and unemployment rate among women with children under the age of 6 in the United States with a correlation coefficient (R) of 0.254 and weighted average of 6.4%. Similarly, the statistical analysis conducted on geographies consisting of 240,769,726 people shows a poor positive correlation between the proportion of Argentineans and unemployment rate among women with children under the age of 6 in the United States with a correlation coefficient (R) of 0.107 and weighted average of 7.2%, a difference of 13.2%.
Unemployment Among Women with Children Under 6 years Correlation Summary
| Measurement | Immigrants from Malaysia | Argentinean |
| Minimum | 1.1% | 2.2% |
| Maximum | 30.8% | 64.0% |
| Range | 29.7% | 61.8% |
| Mean | 7.7% | 12.2% |
| Median | 6.5% | 7.4% |
| Interquartile 25% (IQ1) | 4.5% | 6.6% |
| Interquartile 75% (IQ3) | 8.5% | 11.6% |
| Interquartile Range (IQR) | 4.1% | 5.0% |
| Standard Deviation (Sample) | 5.7% | 12.4% |
| Standard Deviation (Population) | 5.7% | 12.3% |
Similar Demographics by Unemployment Among Women with Children Under 6 years
Demographics Similar to Immigrants from Malaysia by Unemployment Among Women with Children Under 6 years
In terms of unemployment among women with children under 6 years, the demographic groups most similar to Immigrants from Malaysia are Immigrants from Uzbekistan (6.3%, a difference of 0.67%), Thai (6.3%, a difference of 0.97%), Assyrian/Chaldean/Syriac (6.5%, a difference of 0.98%), Immigrants from Bulgaria (6.3%, a difference of 1.1%), and Mongolian (6.5%, a difference of 1.3%).
| Demographics | Rating | Rank | Unemployment Among Women with Children Under 6 years |
| Immigrants | China | 100.0 /100 | #10 | Exceptional 6.2% |
| Indians (Asian) | 100.0 /100 | #11 | Exceptional 6.3% |
| Immigrants | Singapore | 100.0 /100 | #12 | Exceptional 6.3% |
| Immigrants | Eastern Asia | 100.0 /100 | #13 | Exceptional 6.3% |
| Immigrants | Bulgaria | 100.0 /100 | #14 | Exceptional 6.3% |
| Thais | 100.0 /100 | #15 | Exceptional 6.3% |
| Immigrants | Uzbekistan | 100.0 /100 | #16 | Exceptional 6.3% |
| Immigrants | Malaysia | 100.0 /100 | #17 | Exceptional 6.4% |
| Assyrians/Chaldeans/Syriacs | 100.0 /100 | #18 | Exceptional 6.5% |
| Mongolians | 100.0 /100 | #19 | Exceptional 6.5% |
| Ute | 100.0 /100 | #20 | Exceptional 6.5% |
| Burmese | 100.0 /100 | #21 | Exceptional 6.5% |
| Immigrants | Korea | 100.0 /100 | #22 | Exceptional 6.5% |
| Bulgarians | 100.0 /100 | #23 | Exceptional 6.5% |
| Laotians | 100.0 /100 | #24 | Exceptional 6.5% |
Demographics Similar to Argentineans by Unemployment Among Women with Children Under 6 years
In terms of unemployment among women with children under 6 years, the demographic groups most similar to Argentineans are Nicaraguan (7.2%, a difference of 0.040%), Immigrants from Italy (7.2%, a difference of 0.080%), Israeli (7.2%, a difference of 0.12%), Armenian (7.2%, a difference of 0.17%), and Norwegian (7.2%, a difference of 0.23%).
| Demographics | Rating | Rank | Unemployment Among Women with Children Under 6 years |
| Immigrants | Kazakhstan | 97.1 /100 | #107 | Exceptional 7.2% |
| Eastern Europeans | 96.9 /100 | #108 | Exceptional 7.2% |
| Australians | 96.9 /100 | #109 | Exceptional 7.2% |
| Palestinians | 96.8 /100 | #110 | Exceptional 7.2% |
| Norwegians | 96.7 /100 | #111 | Exceptional 7.2% |
| Israelis | 96.5 /100 | #112 | Exceptional 7.2% |
| Nicaraguans | 96.3 /100 | #113 | Exceptional 7.2% |
| Argentineans | 96.2 /100 | #114 | Exceptional 7.2% |
| Immigrants | Italy | 96.1 /100 | #115 | Exceptional 7.2% |
| Armenians | 95.9 /100 | #116 | Exceptional 7.2% |
| Immigrants | Kenya | 95.4 /100 | #117 | Exceptional 7.3% |
| Serbians | 94.5 /100 | #118 | Exceptional 7.3% |
| South Africans | 94.1 /100 | #119 | Exceptional 7.3% |
| Iraqis | 93.9 /100 | #120 | Exceptional 7.3% |
| Immigrants | Chile | 93.5 /100 | #121 | Exceptional 7.3% |