Swedish vs Potawatomi Unemployment Among Youth under 25 years
COMPARE
Swedish
Potawatomi
Unemployment Among Youth under 25 years
Unemployment Among Youth under 25 years Comparison
Swedes
Potawatomi
10.4%
UNEMPLOYMENT AMONG YOUTH UNDER 25 YEARS
100.0/ 100
METRIC RATING
7th/ 347
METRIC RANK
11.6%
UNEMPLOYMENT AMONG YOUTH UNDER 25 YEARS
57.9/ 100
METRIC RATING
168th/ 347
METRIC RANK
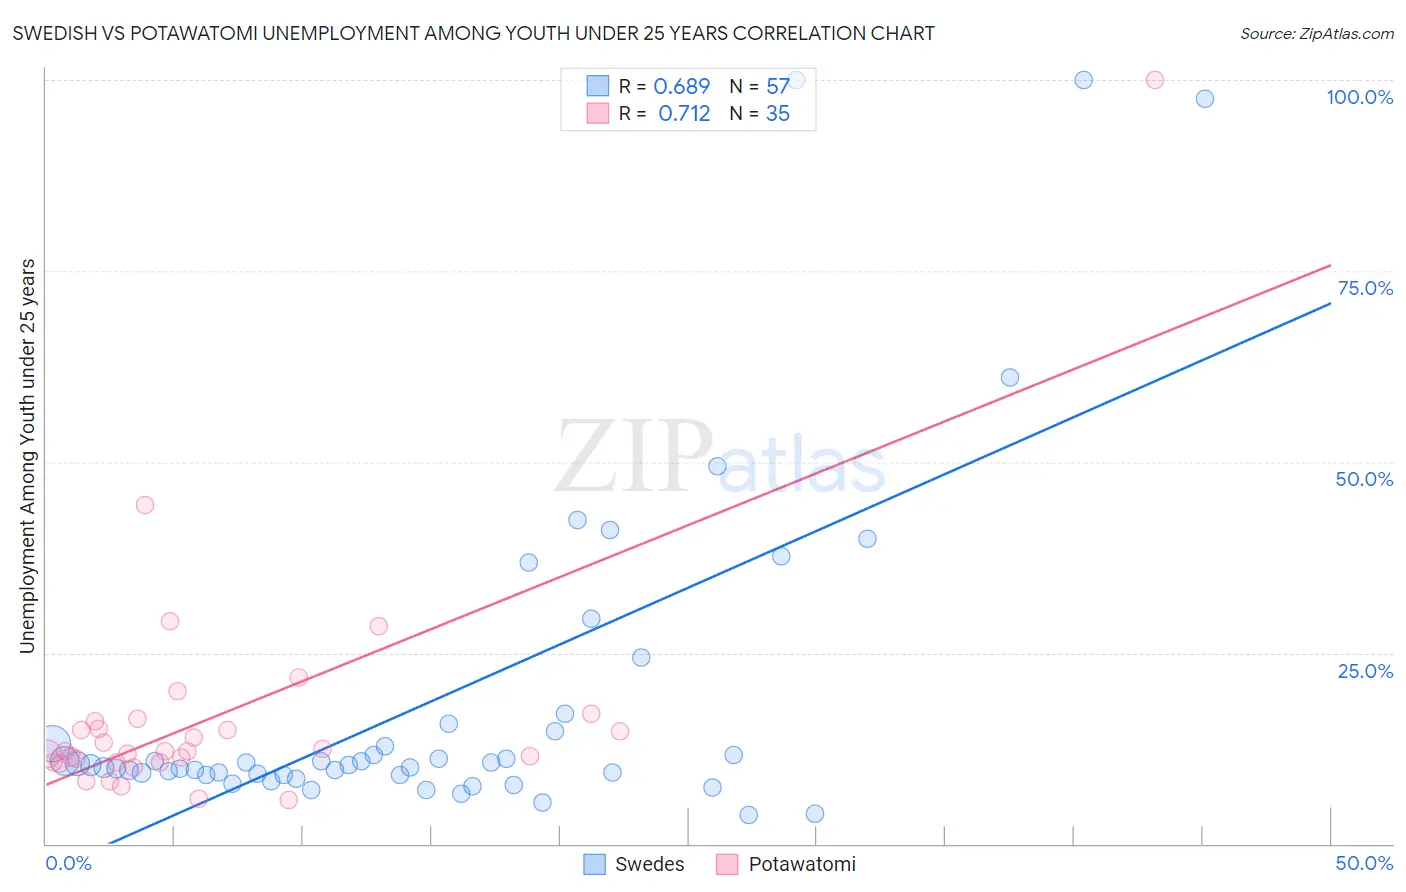
Swedish vs Potawatomi Unemployment Among Youth under 25 years Correlation Chart
The statistical analysis conducted on geographies consisting of 519,578,376 people shows a significant positive correlation between the proportion of Swedes and unemployment rate among youth under the age of 25 in the United States with a correlation coefficient (R) of 0.689 and weighted average of 10.4%. Similarly, the statistical analysis conducted on geographies consisting of 117,120,602 people shows a strong positive correlation between the proportion of Potawatomi and unemployment rate among youth under the age of 25 in the United States with a correlation coefficient (R) of 0.712 and weighted average of 11.6%, a difference of 11.3%.
Unemployment Among Youth under 25 years Correlation Summary
| Measurement | Swedish | Potawatomi |
| Minimum | 3.8% | 5.8% |
| Maximum | 100.0% | 100.0% |
| Range | 96.2% | 94.2% |
| Mean | 19.3% | 16.7% |
| Median | 10.3% | 12.2% |
| Interquartile 25% (IQ1) | 9.0% | 10.6% |
| Interquartile 75% (IQ3) | 15.2% | 16.1% |
| Interquartile Range (IQR) | 6.2% | 5.4% |
| Standard Deviation (Sample) | 22.5% | 16.2% |
| Standard Deviation (Population) | 22.3% | 16.0% |
Similar Demographics by Unemployment Among Youth under 25 years
Demographics Similar to Swedes by Unemployment Among Youth under 25 years
In terms of unemployment among youth under 25 years, the demographic groups most similar to Swedes are Danish (10.3%, a difference of 0.75%), Immigrants from Venezuela (10.5%, a difference of 0.78%), Czech (10.3%, a difference of 0.91%), German (10.5%, a difference of 1.2%), and Immigrants from Somalia (10.5%, a difference of 1.2%).
| Demographics | Rating | Rank | Unemployment Among Youth under 25 years |
| Norwegians | 100.0 /100 | #1 | Exceptional 9.8% |
| Immigrants | Cuba | 100.0 /100 | #2 | Exceptional 10.0% |
| Luxembourgers | 100.0 /100 | #3 | Exceptional 10.0% |
| Zimbabweans | 100.0 /100 | #4 | Exceptional 10.2% |
| Czechs | 100.0 /100 | #5 | Exceptional 10.3% |
| Danes | 100.0 /100 | #6 | Exceptional 10.3% |
| Swedes | 100.0 /100 | #7 | Exceptional 10.4% |
| Immigrants | Venezuela | 100.0 /100 | #8 | Exceptional 10.5% |
| Germans | 100.0 /100 | #9 | Exceptional 10.5% |
| Immigrants | Somalia | 100.0 /100 | #10 | Exceptional 10.5% |
| Scandinavians | 100.0 /100 | #11 | Exceptional 10.5% |
| Immigrants | Sudan | 100.0 /100 | #12 | Exceptional 10.5% |
| Indonesians | 100.0 /100 | #13 | Exceptional 10.6% |
| Cubans | 100.0 /100 | #14 | Exceptional 10.6% |
| Sudanese | 100.0 /100 | #15 | Exceptional 10.6% |
Demographics Similar to Potawatomi by Unemployment Among Youth under 25 years
In terms of unemployment among youth under 25 years, the demographic groups most similar to Potawatomi are Eastern European (11.6%, a difference of 0.010%), Russian (11.6%, a difference of 0.020%), Okinawan (11.6%, a difference of 0.040%), Bangladeshi (11.6%, a difference of 0.10%), and Spanish (11.6%, a difference of 0.11%).
| Demographics | Rating | Rank | Unemployment Among Youth under 25 years |
| Ukrainians | 64.3 /100 | #161 | Good 11.5% |
| Immigrants | Northern Africa | 62.7 /100 | #162 | Good 11.5% |
| Immigrants | Kazakhstan | 62.7 /100 | #163 | Good 11.5% |
| Immigrants | Laos | 62.4 /100 | #164 | Good 11.5% |
| Immigrants | Sweden | 61.3 /100 | #165 | Good 11.5% |
| Spanish | 60.3 /100 | #166 | Good 11.6% |
| Okinawans | 58.7 /100 | #167 | Average 11.6% |
| Potawatomi | 57.9 /100 | #168 | Average 11.6% |
| Eastern Europeans | 57.5 /100 | #169 | Average 11.6% |
| Russians | 57.3 /100 | #170 | Average 11.6% |
| Bangladeshis | 55.6 /100 | #171 | Average 11.6% |
| Immigrants | Morocco | 55.1 /100 | #172 | Average 11.6% |
| Immigrants | South Eastern Asia | 51.7 /100 | #173 | Average 11.6% |
| Immigrants | China | 50.0 /100 | #174 | Average 11.6% |
| Immigrants | Iraq | 47.0 /100 | #175 | Average 11.6% |