Sudanese vs Lebanese Unemployment Among Ages 65 to 74 years
COMPARE
Sudanese
Lebanese
Unemployment Among Ages 65 to 74 years
Unemployment Among Ages 65 to 74 years Comparison
Sudanese
Lebanese
4.6%
UNEMPLOYMENT AMONG AGES 65 TO 74 YEARS
100.0/ 100
METRIC RATING
5th/ 347
METRIC RANK
4.9%
UNEMPLOYMENT AMONG AGES 65 TO 74 YEARS
100.0/ 100
METRIC RATING
22nd/ 347
METRIC RANK
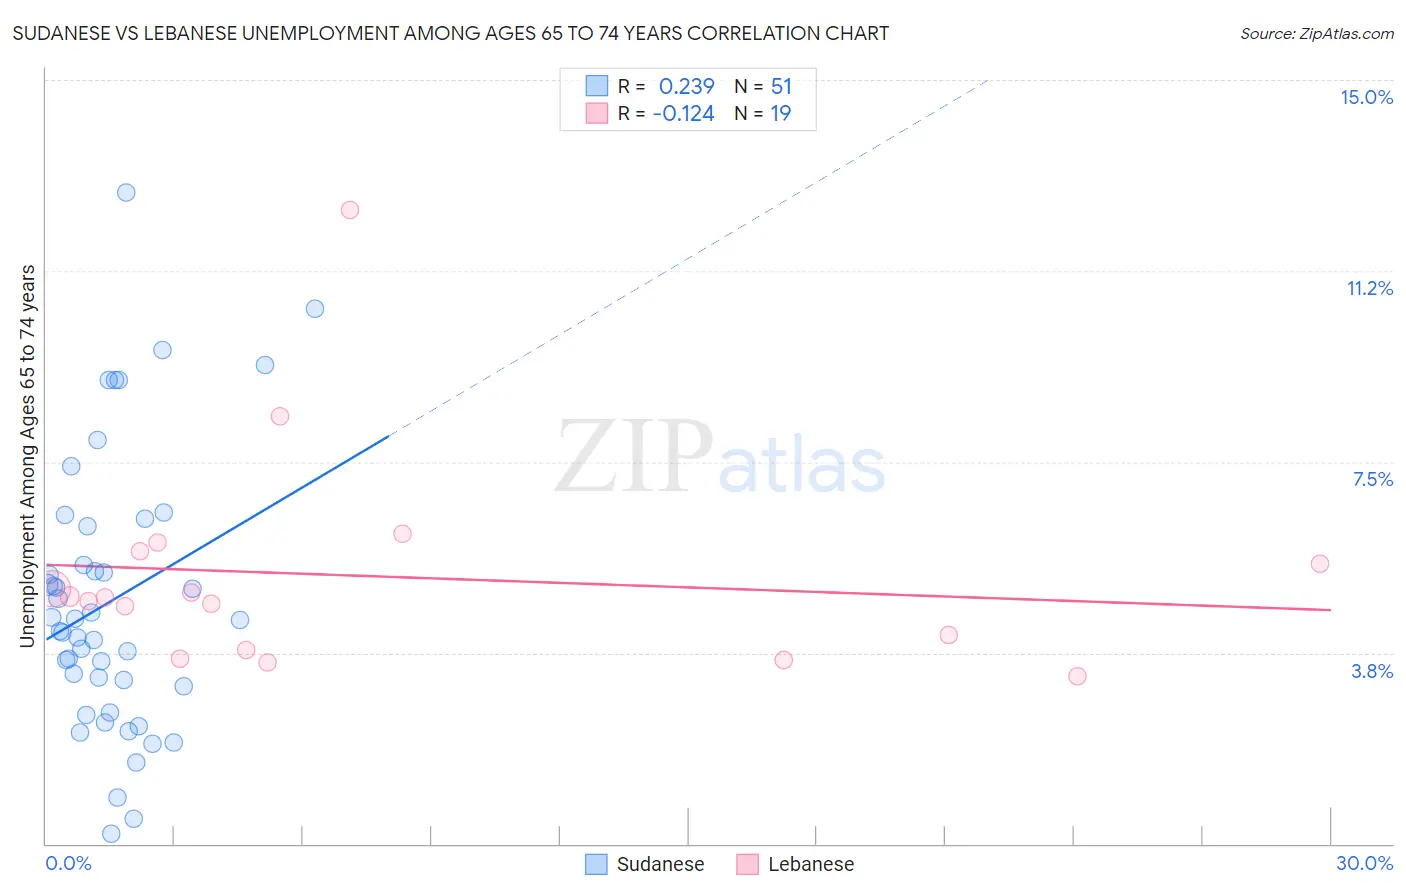
Sudanese vs Lebanese Unemployment Among Ages 65 to 74 years Correlation Chart
The statistical analysis conducted on geographies consisting of 104,906,634 people shows a weak positive correlation between the proportion of Sudanese and unemployment rate among population between the ages 65 and 74 in the United States with a correlation coefficient (R) of 0.239 and weighted average of 4.6%. Similarly, the statistical analysis conducted on geographies consisting of 352,325,673 people shows a poor negative correlation between the proportion of Lebanese and unemployment rate among population between the ages 65 and 74 in the United States with a correlation coefficient (R) of -0.124 and weighted average of 4.9%, a difference of 6.4%.
Unemployment Among Ages 65 to 74 years Correlation Summary
| Measurement | Sudanese | Lebanese |
| Minimum | 0.20% | 3.3% |
| Maximum | 12.8% | 12.4% |
| Range | 12.6% | 9.1% |
| Mean | 4.8% | 5.3% |
| Median | 4.4% | 4.8% |
| Interquartile 25% (IQ1) | 3.1% | 3.8% |
| Interquartile 75% (IQ3) | 6.2% | 5.7% |
| Interquartile Range (IQR) | 3.1% | 1.9% |
| Standard Deviation (Sample) | 2.7% | 2.1% |
| Standard Deviation (Population) | 2.7% | 2.0% |
Demographics Similar to Sudanese and Lebanese by Unemployment Among Ages 65 to 74 years
In terms of unemployment among ages 65 to 74 years, the demographic groups most similar to Sudanese are Tsimshian (4.6%, a difference of 0.36%), Immigrants from Cuba (4.6%, a difference of 0.51%), Fijian (4.5%, a difference of 1.9%), Indonesian (4.7%, a difference of 1.9%), and Comanche (4.7%, a difference of 2.1%). Similarly, the demographic groups most similar to Lebanese are Immigrants from Nepal (4.9%, a difference of 0.38%), Immigrants from Eritrea (4.9%, a difference of 0.75%), Immigrants from Zaire (4.8%, a difference of 1.1%), Menominee (4.8%, a difference of 1.4%), and Creek (4.8%, a difference of 1.4%).
| Demographics | Rating | Rank | Unemployment Among Ages 65 to 74 years |
| Fijians | 100.0 /100 | #3 | Exceptional 4.5% |
| Tsimshian | 100.0 /100 | #4 | Exceptional 4.6% |
| Sudanese | 100.0 /100 | #5 | Exceptional 4.6% |
| Immigrants | Cuba | 100.0 /100 | #6 | Exceptional 4.6% |
| Indonesians | 100.0 /100 | #7 | Exceptional 4.7% |
| Comanche | 100.0 /100 | #8 | Exceptional 4.7% |
| Chickasaw | 100.0 /100 | #9 | Exceptional 4.7% |
| Osage | 100.0 /100 | #10 | Exceptional 4.7% |
| Immigrants | Congo | 100.0 /100 | #11 | Exceptional 4.7% |
| Tongans | 100.0 /100 | #12 | Exceptional 4.7% |
| Lumbee | 100.0 /100 | #13 | Exceptional 4.8% |
| Cubans | 100.0 /100 | #14 | Exceptional 4.8% |
| Immigrants | North Macedonia | 100.0 /100 | #15 | Exceptional 4.8% |
| Immigrants | Burma/Myanmar | 100.0 /100 | #16 | Exceptional 4.8% |
| Kenyans | 100.0 /100 | #17 | Exceptional 4.8% |
| Creek | 100.0 /100 | #18 | Exceptional 4.8% |
| Menominee | 100.0 /100 | #19 | Exceptional 4.8% |
| Immigrants | Zaire | 100.0 /100 | #20 | Exceptional 4.8% |
| Immigrants | Eritrea | 100.0 /100 | #21 | Exceptional 4.9% |
| Lebanese | 100.0 /100 | #22 | Exceptional 4.9% |
| Immigrants | Nepal | 100.0 /100 | #23 | Exceptional 4.9% |