Immigrants from Bolivia vs Turkish Unemployment Among Ages 65 to 74 years
COMPARE
Immigrants from Bolivia
Turkish
Unemployment Among Ages 65 to 74 years
Unemployment Among Ages 65 to 74 years Comparison
Immigrants from Bolivia
Turks
5.2%
UNEMPLOYMENT AMONG AGES 65 TO 74 YEARS
93.6/ 100
METRIC RATING
110th/ 347
METRIC RANK
5.3%
UNEMPLOYMENT AMONG AGES 65 TO 74 YEARS
76.2/ 100
METRIC RATING
142nd/ 347
METRIC RANK
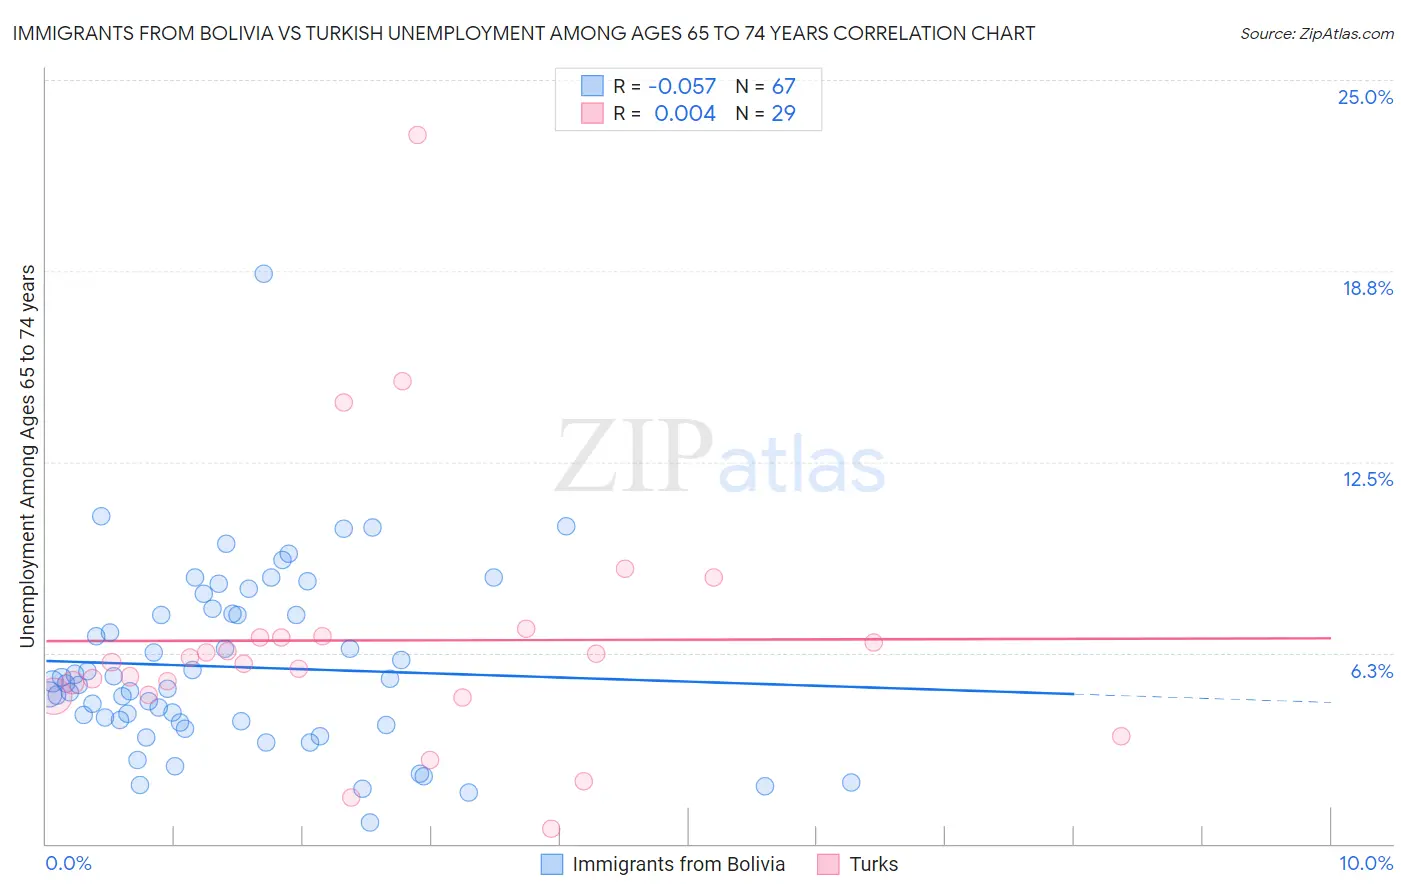
Immigrants from Bolivia vs Turkish Unemployment Among Ages 65 to 74 years Correlation Chart
The statistical analysis conducted on geographies consisting of 150,455,736 people shows a slight negative correlation between the proportion of Immigrants from Bolivia and unemployment rate among population between the ages 65 and 74 in the United States with a correlation coefficient (R) of -0.057 and weighted average of 5.2%. Similarly, the statistical analysis conducted on geographies consisting of 249,999,794 people shows no correlation between the proportion of Turks and unemployment rate among population between the ages 65 and 74 in the United States with a correlation coefficient (R) of 0.004 and weighted average of 5.3%, a difference of 1.3%.
Unemployment Among Ages 65 to 74 years Correlation Summary
| Measurement | Immigrants from Bolivia | Turkish |
| Minimum | 0.70% | 0.50% |
| Maximum | 18.6% | 23.2% |
| Range | 17.9% | 22.7% |
| Mean | 5.8% | 6.7% |
| Median | 5.2% | 5.9% |
| Interquartile 25% (IQ1) | 4.0% | 4.9% |
| Interquartile 75% (IQ3) | 7.5% | 6.8% |
| Interquartile Range (IQR) | 3.6% | 1.9% |
| Standard Deviation (Sample) | 2.9% | 4.4% |
| Standard Deviation (Population) | 2.9% | 4.3% |
Similar Demographics by Unemployment Among Ages 65 to 74 years
Demographics Similar to Immigrants from Bolivia by Unemployment Among Ages 65 to 74 years
In terms of unemployment among ages 65 to 74 years, the demographic groups most similar to Immigrants from Bolivia are Immigrants from Singapore (5.2%, a difference of 0.050%), Immigrants from Malaysia (5.2%, a difference of 0.080%), Sri Lankan (5.3%, a difference of 0.11%), Austrian (5.2%, a difference of 0.14%), and Immigrants from South Central Asia (5.3%, a difference of 0.16%).
| Demographics | Rating | Rank | Unemployment Among Ages 65 to 74 years |
| Immigrants | Vietnam | 95.6 /100 | #103 | Exceptional 5.2% |
| Yugoslavians | 95.5 /100 | #104 | Exceptional 5.2% |
| Iranians | 95.2 /100 | #105 | Exceptional 5.2% |
| Malaysians | 95.1 /100 | #106 | Exceptional 5.2% |
| Austrians | 94.5 /100 | #107 | Exceptional 5.2% |
| Immigrants | Malaysia | 94.1 /100 | #108 | Exceptional 5.2% |
| Immigrants | Singapore | 93.9 /100 | #109 | Exceptional 5.2% |
| Immigrants | Bolivia | 93.6 /100 | #110 | Exceptional 5.2% |
| Sri Lankans | 92.7 /100 | #111 | Exceptional 5.3% |
| Immigrants | South Central Asia | 92.4 /100 | #112 | Exceptional 5.3% |
| Immigrants | Germany | 91.6 /100 | #113 | Exceptional 5.3% |
| Asians | 91.1 /100 | #114 | Exceptional 5.3% |
| Immigrants | Turkey | 90.8 /100 | #115 | Exceptional 5.3% |
| Australians | 90.4 /100 | #116 | Exceptional 5.3% |
| Immigrants | Korea | 90.2 /100 | #117 | Exceptional 5.3% |
Demographics Similar to Turks by Unemployment Among Ages 65 to 74 years
In terms of unemployment among ages 65 to 74 years, the demographic groups most similar to Turks are New Zealander (5.3%, a difference of 0.0%), Immigrants from Chile (5.3%, a difference of 0.010%), Canadian (5.3%, a difference of 0.050%), Irish (5.3%, a difference of 0.060%), and Immigrants from Latvia (5.3%, a difference of 0.070%).
| Demographics | Rating | Rank | Unemployment Among Ages 65 to 74 years |
| Immigrants | Serbia | 81.8 /100 | #135 | Excellent 5.3% |
| Celtics | 80.8 /100 | #136 | Excellent 5.3% |
| Immigrants | Afghanistan | 80.8 /100 | #137 | Excellent 5.3% |
| Chileans | 79.7 /100 | #138 | Good 5.3% |
| Finns | 79.0 /100 | #139 | Good 5.3% |
| Immigrants | Laos | 78.6 /100 | #140 | Good 5.3% |
| Immigrants | Asia | 78.4 /100 | #141 | Good 5.3% |
| Turks | 76.2 /100 | #142 | Good 5.3% |
| New Zealanders | 76.1 /100 | #143 | Good 5.3% |
| Immigrants | Chile | 76.0 /100 | #144 | Good 5.3% |
| Canadians | 75.0 /100 | #145 | Good 5.3% |
| Irish | 74.8 /100 | #146 | Good 5.3% |
| Immigrants | Latvia | 74.6 /100 | #147 | Good 5.3% |
| Immigrants | Sri Lanka | 73.8 /100 | #148 | Good 5.3% |
| Immigrants | Romania | 73.5 /100 | #149 | Good 5.3% |