Navajo vs Taiwanese Unemployment Among Seniors over 65 years
COMPARE
Navajo
Taiwanese
Unemployment Among Seniors over 65 years
Unemployment Among Seniors over 65 years Comparison
Navajo
Taiwanese
6.7%
UNEMPLOYMENT AMONG SENIORS OVER 65 YEARS
0.0/ 100
METRIC RATING
342nd/ 347
METRIC RANK
6.0%
UNEMPLOYMENT AMONG SENIORS OVER 65 YEARS
0.0/ 100
METRIC RATING
331st/ 347
METRIC RANK
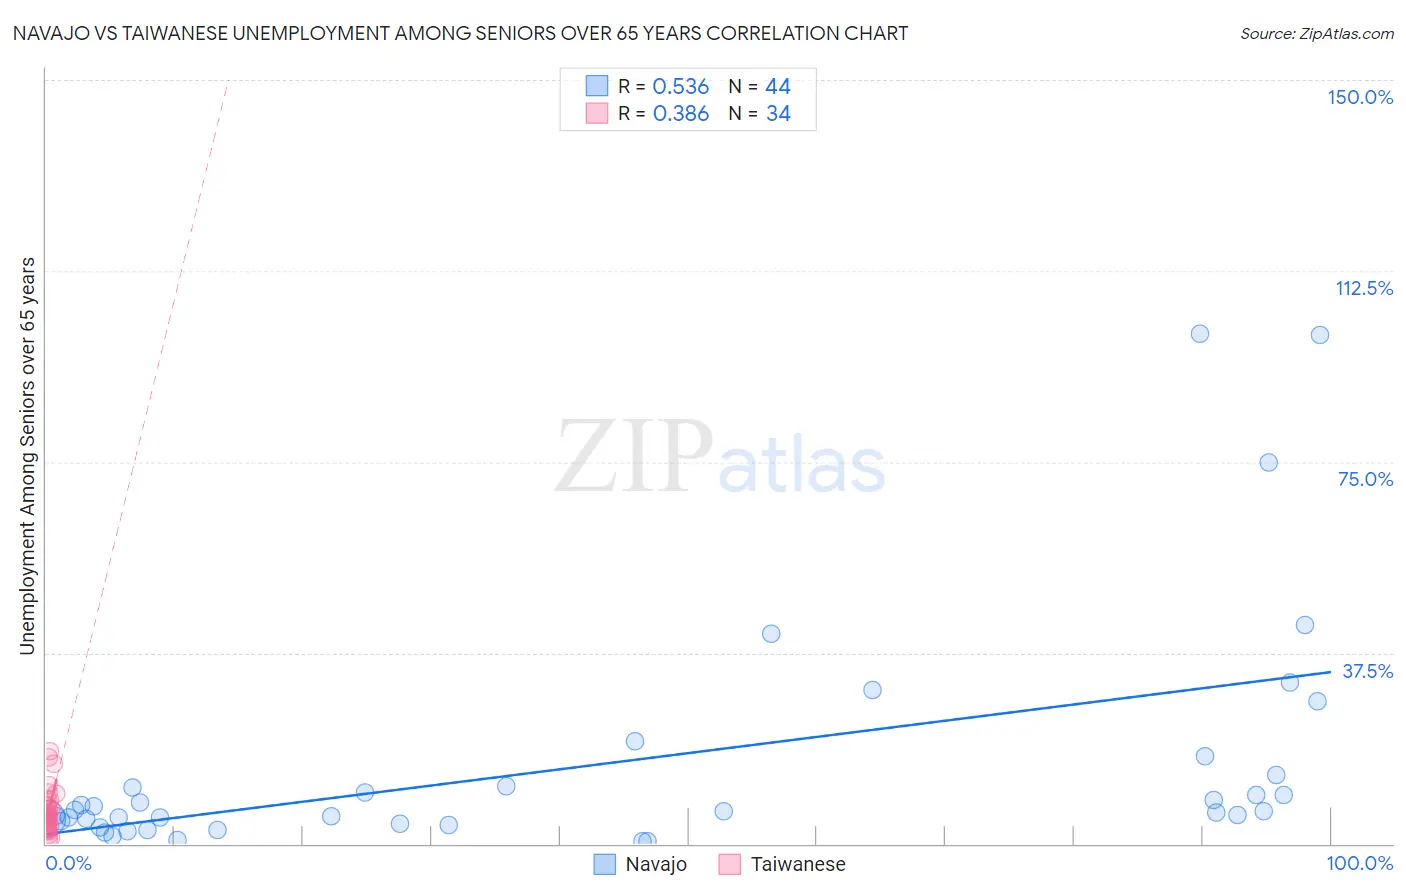
Navajo vs Taiwanese Unemployment Among Seniors over 65 years Correlation Chart
The statistical analysis conducted on geographies consisting of 207,679,315 people shows a substantial positive correlation between the proportion of Navajo and unemployment rate amomg seniors over the age of 65 in the United States with a correlation coefficient (R) of 0.536 and weighted average of 6.7%. Similarly, the statistical analysis conducted on geographies consisting of 31,497,797 people shows a mild positive correlation between the proportion of Taiwanese and unemployment rate amomg seniors over the age of 65 in the United States with a correlation coefficient (R) of 0.386 and weighted average of 6.0%, a difference of 12.2%.
Unemployment Among Seniors over 65 years Correlation Summary
| Measurement | Navajo | Taiwanese |
| Minimum | 0.50% | 1.0% |
| Maximum | 100.1% | 18.1% |
| Range | 99.6% | 17.1% |
| Mean | 15.4% | 6.3% |
| Median | 6.4% | 5.3% |
| Interquartile 25% (IQ1) | 4.3% | 3.3% |
| Interquartile 75% (IQ3) | 12.3% | 7.6% |
| Interquartile Range (IQR) | 8.1% | 4.3% |
| Standard Deviation (Sample) | 23.4% | 4.2% |
| Standard Deviation (Population) | 23.1% | 4.1% |
Demographics Similar to Navajo and Taiwanese by Unemployment Among Seniors over 65 years
In terms of unemployment among seniors over 65 years, the demographic groups most similar to Navajo are Yakama (6.7%, a difference of 0.45%), Tlingit-Haida (6.8%, a difference of 1.3%), Alaskan Athabascan (7.0%, a difference of 5.1%), Ute (6.3%, a difference of 5.9%), and Paiute (6.3%, a difference of 5.9%). Similarly, the demographic groups most similar to Taiwanese are Aleut (6.0%, a difference of 0.050%), Immigrants from Portugal (6.0%, a difference of 0.15%), Dominican (6.0%, a difference of 0.17%), Immigrants from Dominican Republic (6.0%, a difference of 0.60%), and Puerto Rican (5.9%, a difference of 0.92%).
| Demographics | Rating | Rank | Unemployment Among Seniors over 65 years |
| Shoshone | 0.0 /100 | #326 | Tragic 5.9% |
| Bermudans | 0.0 /100 | #327 | Tragic 5.9% |
| Puerto Ricans | 0.0 /100 | #328 | Tragic 5.9% |
| Dominicans | 0.0 /100 | #329 | Tragic 6.0% |
| Immigrants | Portugal | 0.0 /100 | #330 | Tragic 6.0% |
| Taiwanese | 0.0 /100 | #331 | Tragic 6.0% |
| Aleuts | 0.0 /100 | #332 | Tragic 6.0% |
| Immigrants | Dominican Republic | 0.0 /100 | #333 | Tragic 6.0% |
| Tohono O'odham | 0.0 /100 | #334 | Tragic 6.1% |
| Immigrants | Armenia | 0.0 /100 | #335 | Tragic 6.2% |
| Pima | 0.0 /100 | #336 | Tragic 6.3% |
| Alaska Natives | 0.0 /100 | #337 | Tragic 6.3% |
| Immigrants | Azores | 0.0 /100 | #338 | Tragic 6.3% |
| Paiute | 0.0 /100 | #339 | Tragic 6.3% |
| Ute | 0.0 /100 | #340 | Tragic 6.3% |
| Yakama | 0.0 /100 | #341 | Tragic 6.7% |
| Navajo | 0.0 /100 | #342 | Tragic 6.7% |
| Tlingit-Haida | 0.0 /100 | #343 | Tragic 6.8% |
| Alaskan Athabascans | 0.0 /100 | #344 | Tragic 7.0% |
| Immigrants | Yemen | 0.0 /100 | #345 | Tragic 8.2% |
| Yup'ik | 0.0 /100 | #346 | Tragic 9.1% |