Costa Rican vs Palestinian Unemployment Among Youth under 25 years
COMPARE
Costa Rican
Palestinian
Unemployment Among Youth under 25 years
Unemployment Among Youth under 25 years Comparison
Costa Ricans
Palestinians
11.9%
UNEMPLOYMENT AMONG YOUTH UNDER 25 YEARS
8.2/ 100
METRIC RATING
214th/ 347
METRIC RANK
11.8%
UNEMPLOYMENT AMONG YOUTH UNDER 25 YEARS
16.0/ 100
METRIC RATING
201st/ 347
METRIC RANK
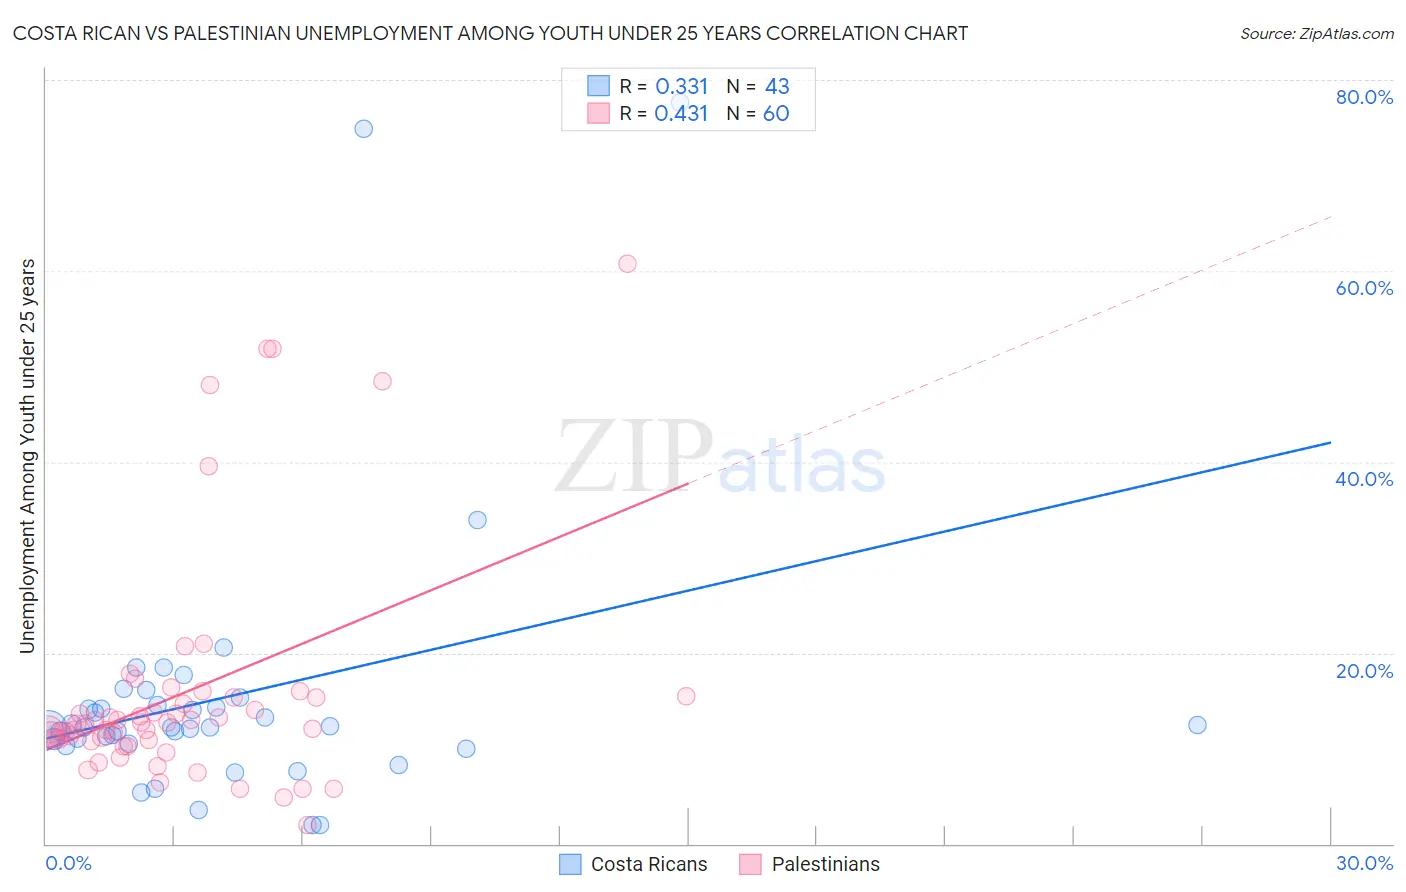
Costa Rican vs Palestinian Unemployment Among Youth under 25 years Correlation Chart
The statistical analysis conducted on geographies consisting of 252,278,849 people shows a mild positive correlation between the proportion of Costa Ricans and unemployment rate among youth under the age of 25 in the United States with a correlation coefficient (R) of 0.331 and weighted average of 11.9%. Similarly, the statistical analysis conducted on geographies consisting of 215,804,460 people shows a moderate positive correlation between the proportion of Palestinians and unemployment rate among youth under the age of 25 in the United States with a correlation coefficient (R) of 0.431 and weighted average of 11.8%, a difference of 0.77%.
Unemployment Among Youth under 25 years Correlation Summary
| Measurement | Costa Rican | Palestinian |
| Minimum | 2.0% | 2.0% |
| Maximum | 77.7% | 60.7% |
| Range | 75.7% | 58.7% |
| Mean | 15.3% | 15.7% |
| Median | 12.1% | 12.6% |
| Interquartile 25% (IQ1) | 10.5% | 10.8% |
| Interquartile 75% (IQ3) | 14.5% | 15.3% |
| Interquartile Range (IQR) | 4.0% | 4.5% |
| Standard Deviation (Sample) | 14.6% | 12.2% |
| Standard Deviation (Population) | 14.4% | 12.1% |
Demographics Similar to Costa Ricans and Palestinians by Unemployment Among Youth under 25 years
In terms of unemployment among youth under 25 years, the demographic groups most similar to Costa Ricans are South American (11.9%, a difference of 0.050%), Samoan (11.9%, a difference of 0.11%), Colombian (11.9%, a difference of 0.12%), Immigrants from Philippines (11.9%, a difference of 0.13%), and Guamanian/Chamorro (11.9%, a difference of 0.17%). Similarly, the demographic groups most similar to Palestinians are Marshallese (11.8%, a difference of 0.020%), Immigrants from Peru (11.8%, a difference of 0.050%), Immigrants from Costa Rica (11.8%, a difference of 0.060%), Arab (11.8%, a difference of 0.15%), and Peruvian (11.8%, a difference of 0.16%).
| Demographics | Rating | Rank | Unemployment Among Youth under 25 years |
| Koreans | 23.9 /100 | #197 | Fair 11.7% |
| Cherokee | 21.2 /100 | #198 | Fair 11.8% |
| Immigrants | Colombia | 20.9 /100 | #199 | Fair 11.8% |
| Arabs | 18.0 /100 | #200 | Poor 11.8% |
| Palestinians | 16.0 /100 | #201 | Poor 11.8% |
| Marshallese | 15.8 /100 | #202 | Poor 11.8% |
| Immigrants | Peru | 15.3 /100 | #203 | Poor 11.8% |
| Immigrants | Costa Rica | 15.2 /100 | #204 | Poor 11.8% |
| Peruvians | 14.0 /100 | #205 | Poor 11.8% |
| Immigrants | Pakistan | 12.6 /100 | #206 | Poor 11.8% |
| Immigrants | Southern Europe | 12.3 /100 | #207 | Poor 11.8% |
| Comanche | 12.1 /100 | #208 | Poor 11.8% |
| Immigrants | Lebanon | 11.3 /100 | #209 | Poor 11.8% |
| Assyrians/Chaldeans/Syriacs | 9.8 /100 | #210 | Tragic 11.9% |
| Immigrants | Philippines | 9.2 /100 | #211 | Tragic 11.9% |
| Colombians | 9.1 /100 | #212 | Tragic 11.9% |
| South Americans | 8.5 /100 | #213 | Tragic 11.9% |
| Costa Ricans | 8.2 /100 | #214 | Tragic 11.9% |
| Samoans | 7.4 /100 | #215 | Tragic 11.9% |
| Guamanians/Chamorros | 7.0 /100 | #216 | Tragic 11.9% |
| Yaqui | 6.9 /100 | #217 | Tragic 11.9% |