Immigrants from Pakistan vs Barbadian Unemployment Among Seniors over 75 years
COMPARE
Immigrants from Pakistan
Barbadian
Unemployment Among Seniors over 75 years
Unemployment Among Seniors over 75 years Comparison
Immigrants from Pakistan
Barbadians
8.6%
UNEMPLOYMENT AMONG SENIORS OVER 75 YEARS
79.7/ 100
METRIC RATING
154th/ 347
METRIC RANK
8.5%
UNEMPLOYMENT AMONG SENIORS OVER 75 YEARS
88.6/ 100
METRIC RATING
139th/ 347
METRIC RANK
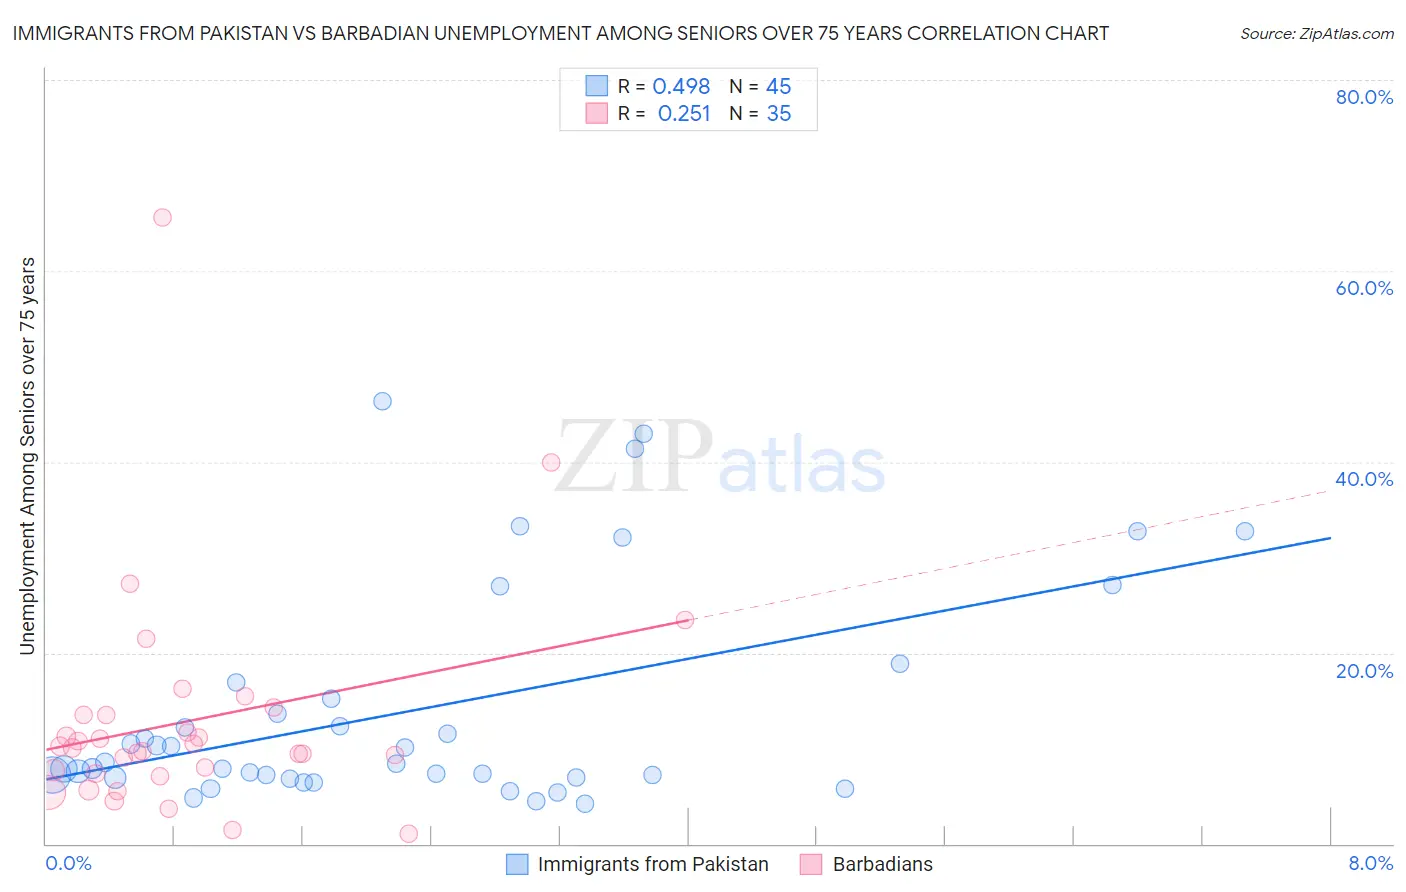
Immigrants from Pakistan vs Barbadian Unemployment Among Seniors over 75 years Correlation Chart
The statistical analysis conducted on geographies consisting of 164,769,281 people shows a moderate positive correlation between the proportion of Immigrants from Pakistan and unemployment rate among seniors over the age of 75 in the United States with a correlation coefficient (R) of 0.498 and weighted average of 8.6%. Similarly, the statistical analysis conducted on geographies consisting of 99,705,389 people shows a weak positive correlation between the proportion of Barbadians and unemployment rate among seniors over the age of 75 in the United States with a correlation coefficient (R) of 0.251 and weighted average of 8.5%, a difference of 0.94%.
Unemployment Among Seniors over 75 years Correlation Summary
| Measurement | Immigrants from Pakistan | Barbadian |
| Minimum | 4.2% | 1.0% |
| Maximum | 46.3% | 65.6% |
| Range | 42.1% | 64.6% |
| Mean | 14.0% | 12.9% |
| Median | 8.4% | 10.0% |
| Interquartile 25% (IQ1) | 7.0% | 7.4% |
| Interquartile 75% (IQ3) | 16.1% | 13.5% |
| Interquartile Range (IQR) | 9.1% | 6.1% |
| Standard Deviation (Sample) | 11.5% | 11.8% |
| Standard Deviation (Population) | 11.3% | 11.6% |
Demographics Similar to Immigrants from Pakistan and Barbadians by Unemployment Among Seniors over 75 years
In terms of unemployment among seniors over 75 years, the demographic groups most similar to Immigrants from Pakistan are Mongolian (8.6%, a difference of 0.040%), Latvian (8.6%, a difference of 0.070%), Immigrants from Bosnia and Herzegovina (8.6%, a difference of 0.080%), Ecuadorian (8.6%, a difference of 0.10%), and Paiute (8.6%, a difference of 0.25%). Similarly, the demographic groups most similar to Barbadians are South American (8.5%, a difference of 0.090%), Immigrants from Bolivia (8.5%, a difference of 0.090%), Immigrants from Bulgaria (8.5%, a difference of 0.14%), Immigrants from Ukraine (8.5%, a difference of 0.20%), and Immigrants from Costa Rica (8.5%, a difference of 0.23%).
| Demographics | Rating | Rank | Unemployment Among Seniors over 75 years |
| Immigrants | Trinidad and Tobago | 90.8 /100 | #136 | Exceptional 8.5% |
| Immigrants | Kuwait | 90.5 /100 | #137 | Exceptional 8.5% |
| Immigrants | Bulgaria | 89.6 /100 | #138 | Excellent 8.5% |
| Barbadians | 88.6 /100 | #139 | Excellent 8.5% |
| South Americans | 87.9 /100 | #140 | Excellent 8.5% |
| Immigrants | Bolivia | 87.9 /100 | #141 | Excellent 8.5% |
| Immigrants | Ukraine | 87.0 /100 | #142 | Excellent 8.5% |
| Immigrants | Costa Rica | 86.8 /100 | #143 | Excellent 8.5% |
| Colombians | 86.7 /100 | #144 | Excellent 8.5% |
| Immigrants | Romania | 86.2 /100 | #145 | Excellent 8.5% |
| Immigrants | South Eastern Asia | 85.8 /100 | #146 | Excellent 8.5% |
| Immigrants | Sierra Leone | 85.6 /100 | #147 | Excellent 8.5% |
| Immigrants | Colombia | 85.6 /100 | #148 | Excellent 8.5% |
| Immigrants | Ecuador | 84.6 /100 | #149 | Excellent 8.5% |
| Paiute | 82.5 /100 | #150 | Excellent 8.6% |
| Immigrants | Bosnia and Herzegovina | 80.6 /100 | #151 | Excellent 8.6% |
| Latvians | 80.5 /100 | #152 | Excellent 8.6% |
| Mongolians | 80.1 /100 | #153 | Excellent 8.6% |
| Immigrants | Pakistan | 79.7 /100 | #154 | Good 8.6% |
| Ecuadorians | 78.5 /100 | #155 | Good 8.6% |
| Immigrants | Bahamas | 76.5 /100 | #156 | Good 8.6% |