Inupiat vs Portuguese Female Unemployment
COMPARE
Inupiat
Portuguese
Female Unemployment
Female Unemployment Comparison
Inupiat
Portuguese
8.2%
FEMALE UNEMPLOYMENT
0.0/ 100
METRIC RATING
341st/ 347
METRIC RANK
5.3%
FEMALE UNEMPLOYMENT
28.6/ 100
METRIC RATING
192nd/ 347
METRIC RANK
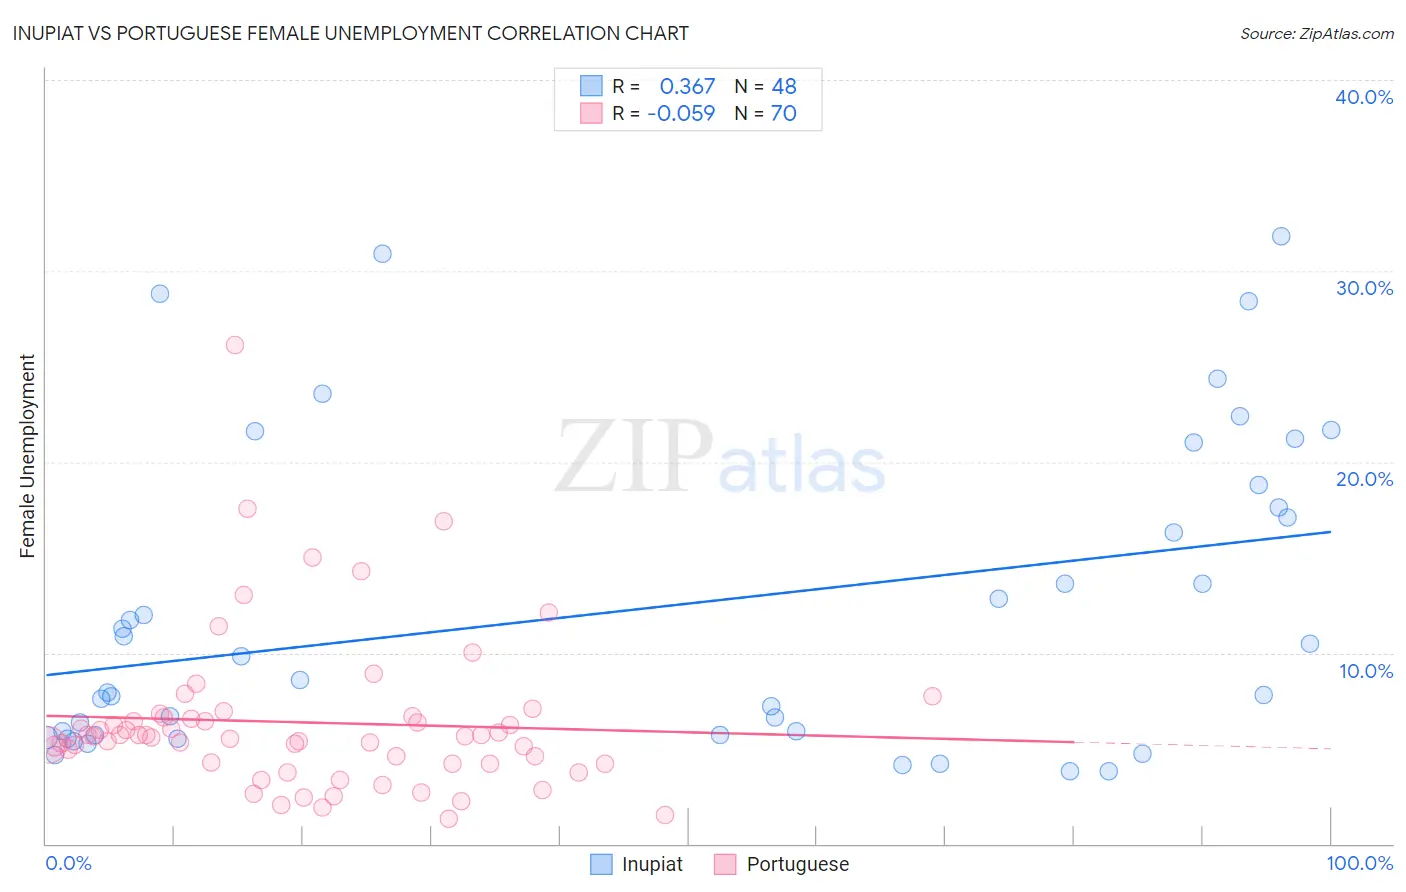
Inupiat vs Portuguese Female Unemployment Correlation Chart
The statistical analysis conducted on geographies consisting of 96,139,159 people shows a mild positive correlation between the proportion of Inupiat and unemploymnet rate among females in the United States with a correlation coefficient (R) of 0.367 and weighted average of 8.2%. Similarly, the statistical analysis conducted on geographies consisting of 446,764,681 people shows a slight negative correlation between the proportion of Portuguese and unemploymnet rate among females in the United States with a correlation coefficient (R) of -0.059 and weighted average of 5.3%, a difference of 53.0%.
Female Unemployment Correlation Summary
| Measurement | Inupiat | Portuguese |
| Minimum | 3.8% | 1.3% |
| Maximum | 31.8% | 26.1% |
| Range | 28.0% | 24.8% |
| Mean | 12.4% | 6.4% |
| Median | 9.2% | 5.6% |
| Interquartile 25% (IQ1) | 5.7% | 4.2% |
| Interquartile 75% (IQ3) | 18.2% | 6.6% |
| Interquartile Range (IQR) | 12.5% | 2.4% |
| Standard Deviation (Sample) | 8.1% | 4.1% |
| Standard Deviation (Population) | 8.0% | 4.1% |
Similar Demographics by Female Unemployment
Demographics Similar to Inupiat by Female Unemployment
In terms of female unemployment, the demographic groups most similar to Inupiat are Hopi (8.1%, a difference of 0.76%), Puerto Rican (8.3%, a difference of 2.2%), Immigrants from Yemen (7.8%, a difference of 4.1%), Tohono O'odham (7.7%, a difference of 5.3%), and Arapaho (8.8%, a difference of 7.7%).
| Demographics | Rating | Rank | Female Unemployment |
| Menominee | 0.0 /100 | #333 | Tragic 7.0% |
| Immigrants | Armenia | 0.0 /100 | #334 | Tragic 7.1% |
| Dominicans | 0.0 /100 | #335 | Tragic 7.2% |
| Immigrants | Dominican Republic | 0.0 /100 | #336 | Tragic 7.2% |
| Navajo | 0.0 /100 | #337 | Tragic 7.3% |
| Tohono O'odham | 0.0 /100 | #338 | Tragic 7.7% |
| Immigrants | Yemen | 0.0 /100 | #339 | Tragic 7.8% |
| Hopi | 0.0 /100 | #340 | Tragic 8.1% |
| Inupiat | 0.0 /100 | #341 | Tragic 8.2% |
| Puerto Ricans | 0.0 /100 | #342 | Tragic 8.3% |
| Arapaho | 0.0 /100 | #343 | Tragic 8.8% |
| Pima | 0.0 /100 | #344 | Tragic 9.3% |
| Yuman | 0.0 /100 | #345 | Tragic 9.6% |
| Yup'ik | 0.0 /100 | #346 | Tragic 10.9% |
| Crow | 0.0 /100 | #347 | Tragic 12.1% |
Demographics Similar to Portuguese by Female Unemployment
In terms of female unemployment, the demographic groups most similar to Portuguese are Arab (5.3%, a difference of 0.070%), Colombian (5.3%, a difference of 0.12%), Cherokee (5.3%, a difference of 0.16%), Ugandan (5.3%, a difference of 0.18%), and Immigrants from Colombia (5.3%, a difference of 0.18%).
| Demographics | Rating | Rank | Female Unemployment |
| Malaysians | 40.1 /100 | #185 | Average 5.3% |
| Immigrants | Belarus | 39.4 /100 | #186 | Fair 5.3% |
| Immigrants | Albania | 35.4 /100 | #187 | Fair 5.3% |
| Afghans | 33.9 /100 | #188 | Fair 5.3% |
| Costa Ricans | 33.8 /100 | #189 | Fair 5.3% |
| Ugandans | 31.2 /100 | #190 | Fair 5.3% |
| Cherokee | 30.8 /100 | #191 | Fair 5.3% |
| Portuguese | 28.6 /100 | #192 | Fair 5.3% |
| Arabs | 27.7 /100 | #193 | Fair 5.3% |
| Colombians | 27.0 /100 | #194 | Fair 5.3% |
| Immigrants | Colombia | 26.2 /100 | #195 | Fair 5.3% |
| Spaniards | 25.2 /100 | #196 | Fair 5.3% |
| Alsatians | 23.9 /100 | #197 | Fair 5.3% |
| Tsimshian | 23.1 /100 | #198 | Fair 5.4% |
| Hawaiians | 22.2 /100 | #199 | Fair 5.4% |