Central American Indian vs Immigrants from Congo Unemployment Among Women with Children Under 18 years
COMPARE
Central American Indian
Immigrants from Congo
Unemployment Among Women with Children Under 18 years
Unemployment Among Women with Children Under 18 years Comparison
Central American Indians
Immigrants from Congo
6.7%
UNEMPLOYMENT AMONG WOMEN WITH CHILDREN UNDER 18 YEARS
0.0/ 100
METRIC RATING
319th/ 347
METRIC RANK
6.0%
UNEMPLOYMENT AMONG WOMEN WITH CHILDREN UNDER 18 YEARS
0.4/ 100
METRIC RATING
253rd/ 347
METRIC RANK
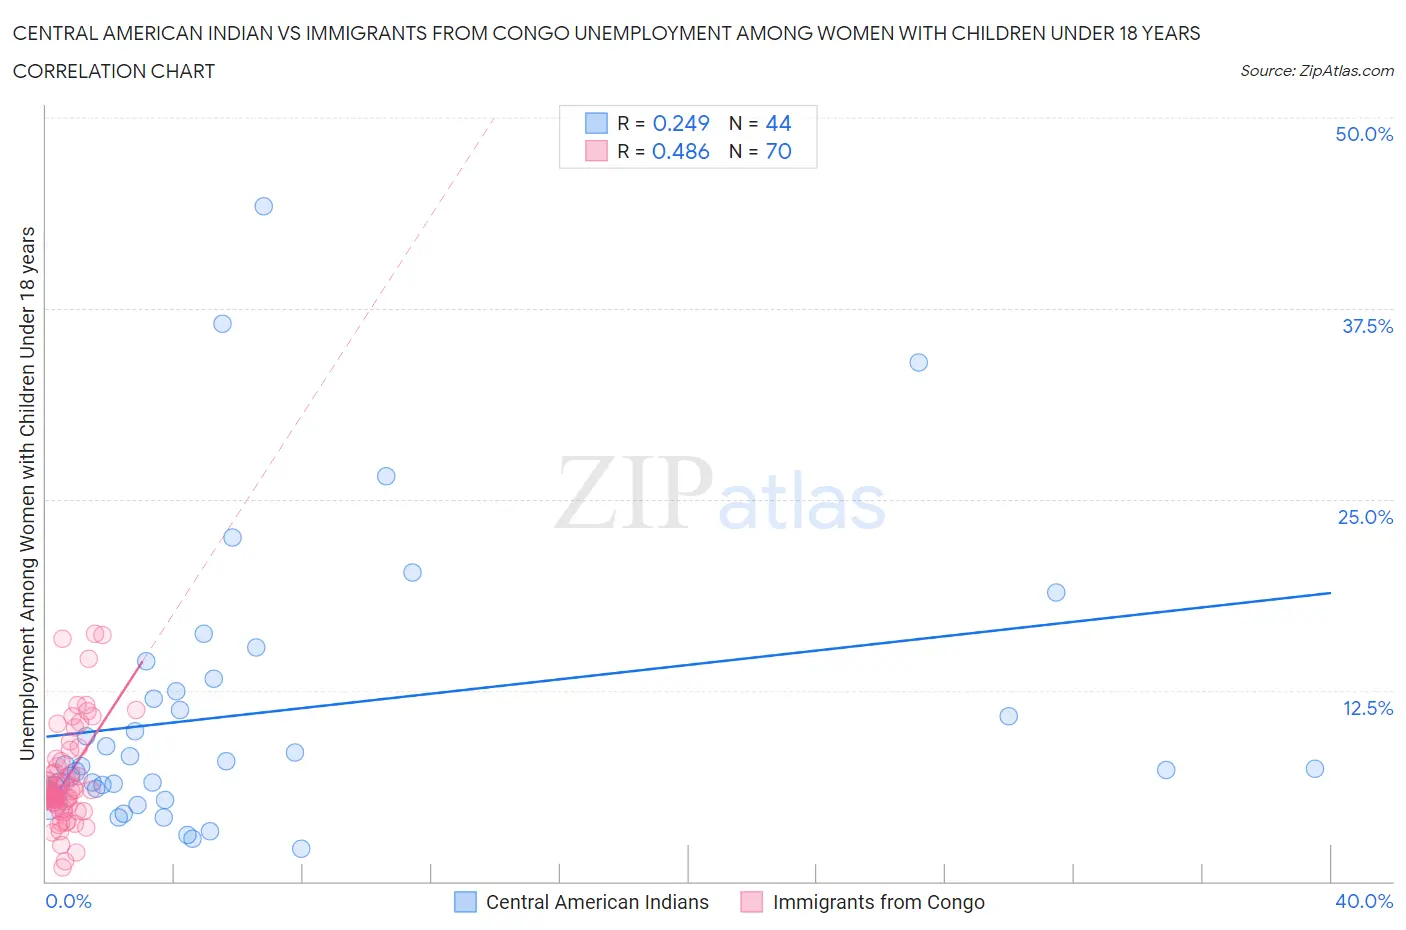
Central American Indian vs Immigrants from Congo Unemployment Among Women with Children Under 18 years Correlation Chart
The statistical analysis conducted on geographies consisting of 319,090,954 people shows a weak positive correlation between the proportion of Central American Indians and unemployment rate among women with children under the age of 18 in the United States with a correlation coefficient (R) of 0.249 and weighted average of 6.7%. Similarly, the statistical analysis conducted on geographies consisting of 91,326,387 people shows a moderate positive correlation between the proportion of Immigrants from Congo and unemployment rate among women with children under the age of 18 in the United States with a correlation coefficient (R) of 0.486 and weighted average of 6.0%, a difference of 11.8%.
Unemployment Among Women with Children Under 18 years Correlation Summary
| Measurement | Central American Indian | Immigrants from Congo |
| Minimum | 2.1% | 0.90% |
| Maximum | 44.2% | 16.2% |
| Range | 42.1% | 15.3% |
| Mean | 11.1% | 6.7% |
| Median | 7.6% | 5.9% |
| Interquartile 25% (IQ1) | 6.0% | 5.0% |
| Interquartile 75% (IQ3) | 12.8% | 7.9% |
| Interquartile Range (IQR) | 6.8% | 2.9% |
| Standard Deviation (Sample) | 9.2% | 3.3% |
| Standard Deviation (Population) | 9.1% | 3.2% |
Similar Demographics by Unemployment Among Women with Children Under 18 years
Demographics Similar to Central American Indians by Unemployment Among Women with Children Under 18 years
In terms of unemployment among women with children under 18 years, the demographic groups most similar to Central American Indians are Immigrants from Belize (6.7%, a difference of 0.090%), U.S. Virgin Islander (6.7%, a difference of 0.14%), Alaska Native (6.7%, a difference of 0.24%), Shoshone (6.6%, a difference of 0.53%), and Immigrants from Ecuador (6.6%, a difference of 0.57%).
| Demographics | Rating | Rank | Unemployment Among Women with Children Under 18 years |
| Immigrants | Mexico | 0.0 /100 | #312 | Tragic 6.6% |
| Hispanics or Latinos | 0.0 /100 | #313 | Tragic 6.6% |
| British West Indians | 0.0 /100 | #314 | Tragic 6.6% |
| Immigrants | West Indies | 0.0 /100 | #315 | Tragic 6.6% |
| Immigrants | Ecuador | 0.0 /100 | #316 | Tragic 6.6% |
| Shoshone | 0.0 /100 | #317 | Tragic 6.6% |
| Alaska Natives | 0.0 /100 | #318 | Tragic 6.7% |
| Central American Indians | 0.0 /100 | #319 | Tragic 6.7% |
| Immigrants | Belize | 0.0 /100 | #320 | Tragic 6.7% |
| U.S. Virgin Islanders | 0.0 /100 | #321 | Tragic 6.7% |
| Houma | 0.0 /100 | #322 | Tragic 6.8% |
| Pueblo | 0.0 /100 | #323 | Tragic 6.8% |
| Paiute | 0.0 /100 | #324 | Tragic 6.9% |
| Immigrants | Dominica | 0.0 /100 | #325 | Tragic 7.0% |
| Chippewa | 0.0 /100 | #326 | Tragic 7.0% |
Demographics Similar to Immigrants from Congo by Unemployment Among Women with Children Under 18 years
In terms of unemployment among women with children under 18 years, the demographic groups most similar to Immigrants from Congo are Seminole (6.0%, a difference of 0.21%), Immigrants from the Azores (6.0%, a difference of 0.75%), Ute (5.9%, a difference of 0.84%), Immigrants from Cabo Verde (5.9%, a difference of 0.85%), and Immigrants from Cameroon (5.9%, a difference of 0.92%).
| Demographics | Rating | Rank | Unemployment Among Women with Children Under 18 years |
| Uruguayans | 1.0 /100 | #246 | Tragic 5.9% |
| Cape Verdeans | 1.0 /100 | #247 | Tragic 5.9% |
| Delaware | 0.8 /100 | #248 | Tragic 5.9% |
| Immigrants | Cameroon | 0.8 /100 | #249 | Tragic 5.9% |
| Immigrants | Cabo Verde | 0.7 /100 | #250 | Tragic 5.9% |
| Ute | 0.7 /100 | #251 | Tragic 5.9% |
| Seminole | 0.5 /100 | #252 | Tragic 6.0% |
| Immigrants | Congo | 0.4 /100 | #253 | Tragic 6.0% |
| Immigrants | Azores | 0.3 /100 | #254 | Tragic 6.0% |
| Liberians | 0.2 /100 | #255 | Tragic 6.0% |
| Nepalese | 0.2 /100 | #256 | Tragic 6.0% |
| Bermudans | 0.1 /100 | #257 | Tragic 6.1% |
| Immigrants | Nigeria | 0.1 /100 | #258 | Tragic 6.1% |
| Ottawa | 0.1 /100 | #259 | Tragic 6.1% |
| Nigerians | 0.1 /100 | #260 | Tragic 6.1% |