Yaqui vs Croatian Unemployment Among Ages 60 to 64 years
COMPARE
Yaqui
Croatian
Unemployment Among Ages 60 to 64 years
Unemployment Among Ages 60 to 64 years Comparison
Yaqui
Croatians
4.8%
UNEMPLOYMENT AMONG AGES 60 TO 64 YEARS
89.5/ 100
METRIC RATING
133rd/ 347
METRIC RANK
4.6%
UNEMPLOYMENT AMONG AGES 60 TO 64 YEARS
99.5/ 100
METRIC RATING
70th/ 347
METRIC RANK
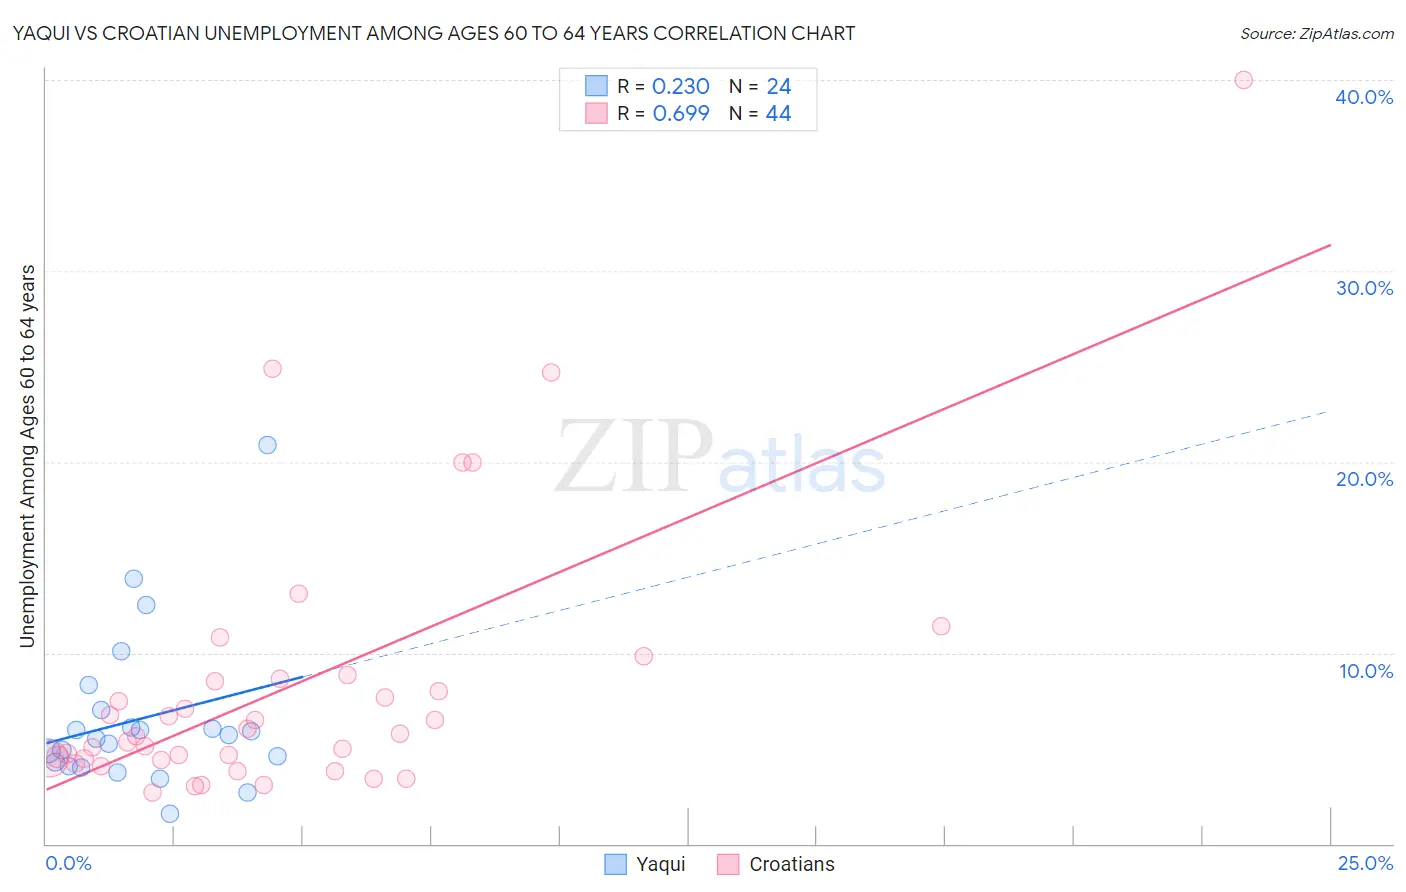
Yaqui vs Croatian Unemployment Among Ages 60 to 64 years Correlation Chart
The statistical analysis conducted on geographies consisting of 104,841,690 people shows a weak positive correlation between the proportion of Yaqui and unemployment rate among population between the ages 60 and 64 in the United States with a correlation coefficient (R) of 0.230 and weighted average of 4.8%. Similarly, the statistical analysis conducted on geographies consisting of 339,281,075 people shows a significant positive correlation between the proportion of Croatians and unemployment rate among population between the ages 60 and 64 in the United States with a correlation coefficient (R) of 0.699 and weighted average of 4.6%, a difference of 3.0%.
Unemployment Among Ages 60 to 64 years Correlation Summary
| Measurement | Yaqui | Croatian |
| Minimum | 1.6% | 2.7% |
| Maximum | 20.9% | 40.0% |
| Range | 19.3% | 37.3% |
| Mean | 6.6% | 8.2% |
| Median | 5.6% | 5.7% |
| Interquartile 25% (IQ1) | 4.2% | 4.4% |
| Interquartile 75% (IQ3) | 6.6% | 8.6% |
| Interquartile Range (IQR) | 2.4% | 4.2% |
| Standard Deviation (Sample) | 4.2% | 7.3% |
| Standard Deviation (Population) | 4.1% | 7.2% |
Similar Demographics by Unemployment Among Ages 60 to 64 years
Demographics Similar to Yaqui by Unemployment Among Ages 60 to 64 years
In terms of unemployment among ages 60 to 64 years, the demographic groups most similar to Yaqui are Immigrants from Lebanon (4.8%, a difference of 0.010%), Lithuanian (4.8%, a difference of 0.010%), Basque (4.8%, a difference of 0.060%), Immigrants from Syria (4.8%, a difference of 0.070%), and Immigrants from Serbia (4.8%, a difference of 0.080%).
| Demographics | Rating | Rank | Unemployment Among Ages 60 to 64 years |
| Immigrants | South Central Asia | 93.0 /100 | #126 | Exceptional 4.7% |
| Austrians | 91.9 /100 | #127 | Exceptional 4.8% |
| Choctaw | 90.3 /100 | #128 | Exceptional 4.8% |
| Immigrants | Serbia | 90.2 /100 | #129 | Exceptional 4.8% |
| Immigrants | Syria | 90.1 /100 | #130 | Exceptional 4.8% |
| Immigrants | Lebanon | 89.6 /100 | #131 | Excellent 4.8% |
| Lithuanians | 89.6 /100 | #132 | Excellent 4.8% |
| Yaqui | 89.5 /100 | #133 | Excellent 4.8% |
| Basques | 88.8 /100 | #134 | Excellent 4.8% |
| Pennsylvania Germans | 87.8 /100 | #135 | Excellent 4.8% |
| French Canadians | 87.6 /100 | #136 | Excellent 4.8% |
| Cambodians | 86.9 /100 | #137 | Excellent 4.8% |
| Immigrants | Lithuania | 86.7 /100 | #138 | Excellent 4.8% |
| Immigrants | Africa | 86.6 /100 | #139 | Excellent 4.8% |
| Pima | 85.8 /100 | #140 | Excellent 4.8% |
Demographics Similar to Croatians by Unemployment Among Ages 60 to 64 years
In terms of unemployment among ages 60 to 64 years, the demographic groups most similar to Croatians are Creek (4.6%, a difference of 0.080%), Slavic (4.6%, a difference of 0.080%), Tongan (4.6%, a difference of 0.090%), Immigrants from Eastern Africa (4.6%, a difference of 0.11%), and Immigrants from Laos (4.6%, a difference of 0.18%).
| Demographics | Rating | Rank | Unemployment Among Ages 60 to 64 years |
| Czechoslovakians | 99.7 /100 | #63 | Exceptional 4.6% |
| Immigrants | Middle Africa | 99.7 /100 | #64 | Exceptional 4.6% |
| Jordanians | 99.7 /100 | #65 | Exceptional 4.6% |
| Hawaiians | 99.6 /100 | #66 | Exceptional 4.6% |
| Immigrants | Scotland | 99.6 /100 | #67 | Exceptional 4.6% |
| Immigrants | Laos | 99.6 /100 | #68 | Exceptional 4.6% |
| Creek | 99.6 /100 | #69 | Exceptional 4.6% |
| Croatians | 99.5 /100 | #70 | Exceptional 4.6% |
| Slavs | 99.5 /100 | #71 | Exceptional 4.6% |
| Tongans | 99.5 /100 | #72 | Exceptional 4.6% |
| Immigrants | Eastern Africa | 99.5 /100 | #73 | Exceptional 4.6% |
| Northern Europeans | 99.3 /100 | #74 | Exceptional 4.6% |
| Potawatomi | 99.3 /100 | #75 | Exceptional 4.6% |
| Slovaks | 99.3 /100 | #76 | Exceptional 4.6% |
| Immigrants | Somalia | 99.2 /100 | #77 | Exceptional 4.6% |