Bangladeshi vs Croatian Unemployment Among Ages 60 to 64 years
COMPARE
Bangladeshi
Croatian
Unemployment Among Ages 60 to 64 years
Unemployment Among Ages 60 to 64 years Comparison
Bangladeshis
Croatians
4.6%
UNEMPLOYMENT AMONG AGES 60 TO 64 YEARS
99.9/ 100
METRIC RATING
55th/ 347
METRIC RANK
4.6%
UNEMPLOYMENT AMONG AGES 60 TO 64 YEARS
99.5/ 100
METRIC RATING
70th/ 347
METRIC RANK
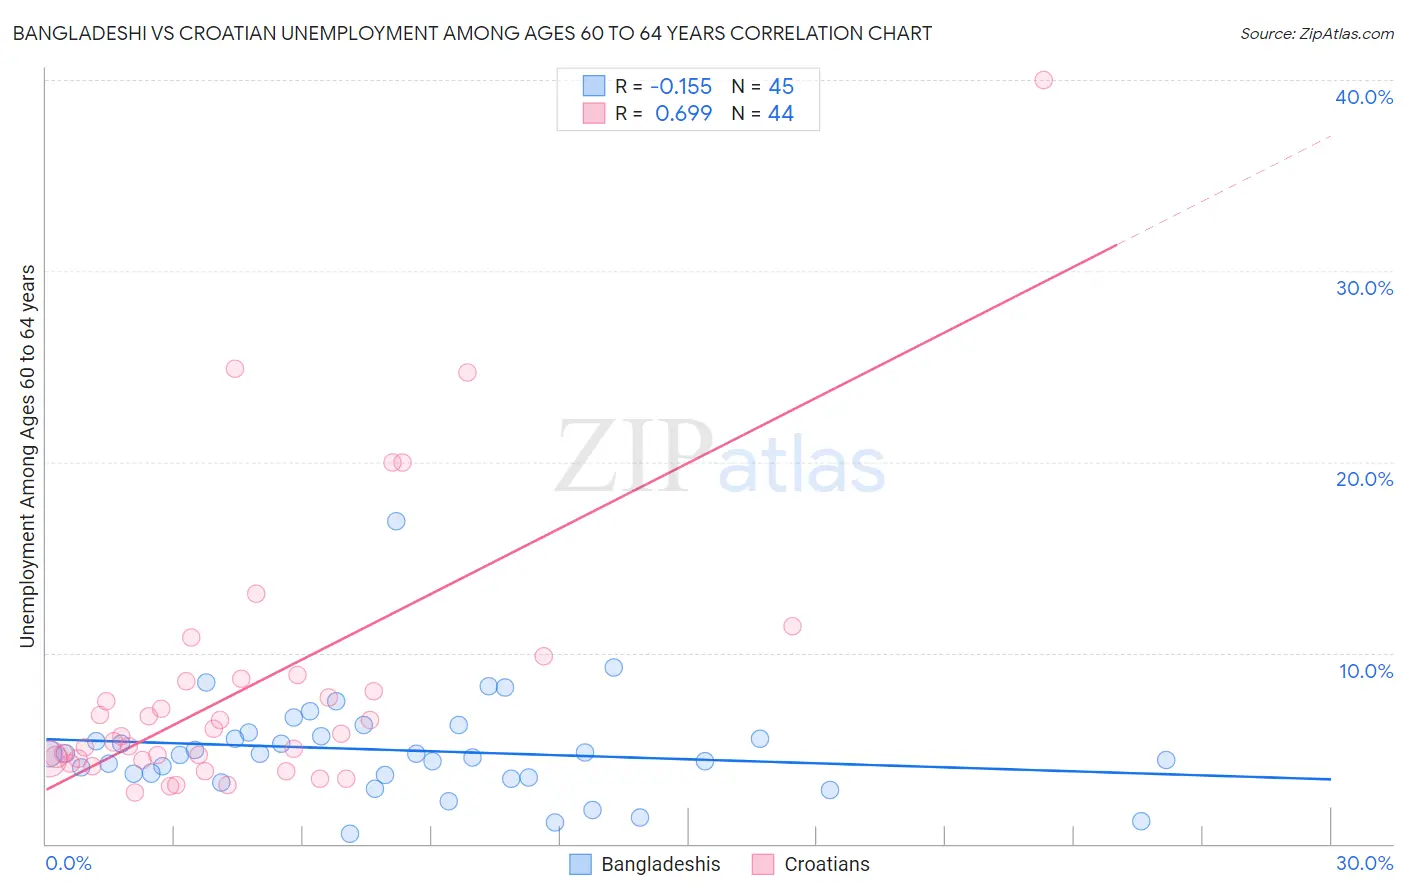
Bangladeshi vs Croatian Unemployment Among Ages 60 to 64 years Correlation Chart
The statistical analysis conducted on geographies consisting of 134,609,028 people shows a poor negative correlation between the proportion of Bangladeshis and unemployment rate among population between the ages 60 and 64 in the United States with a correlation coefficient (R) of -0.155 and weighted average of 4.6%. Similarly, the statistical analysis conducted on geographies consisting of 339,281,075 people shows a significant positive correlation between the proportion of Croatians and unemployment rate among population between the ages 60 and 64 in the United States with a correlation coefficient (R) of 0.699 and weighted average of 4.6%, a difference of 1.2%.
Unemployment Among Ages 60 to 64 years Correlation Summary
| Measurement | Bangladeshi | Croatian |
| Minimum | 0.50% | 2.7% |
| Maximum | 16.9% | 40.0% |
| Range | 16.4% | 37.3% |
| Mean | 4.9% | 8.2% |
| Median | 4.7% | 5.7% |
| Interquartile 25% (IQ1) | 3.5% | 4.4% |
| Interquartile 75% (IQ3) | 5.7% | 8.6% |
| Interquartile Range (IQR) | 2.2% | 4.2% |
| Standard Deviation (Sample) | 2.7% | 7.3% |
| Standard Deviation (Population) | 2.7% | 7.2% |
Demographics Similar to Bangladeshis and Croatians by Unemployment Among Ages 60 to 64 years
In terms of unemployment among ages 60 to 64 years, the demographic groups most similar to Bangladeshis are Dutch (4.6%, a difference of 0.020%), Immigrants from Moldova (4.6%, a difference of 0.050%), Welsh (4.6%, a difference of 0.090%), British (4.6%, a difference of 0.10%), and Kenyan (4.6%, a difference of 0.16%). Similarly, the demographic groups most similar to Croatians are Creek (4.6%, a difference of 0.080%), Slavic (4.6%, a difference of 0.080%), Tongan (4.6%, a difference of 0.090%), Immigrants from Laos (4.6%, a difference of 0.18%), and Immigrants from Scotland (4.6%, a difference of 0.21%).
| Demographics | Rating | Rank | Unemployment Among Ages 60 to 64 years |
| Kenyans | 99.9 /100 | #52 | Exceptional 4.6% |
| Immigrants | Moldova | 99.9 /100 | #53 | Exceptional 4.6% |
| Dutch | 99.9 /100 | #54 | Exceptional 4.6% |
| Bangladeshis | 99.9 /100 | #55 | Exceptional 4.6% |
| Welsh | 99.9 /100 | #56 | Exceptional 4.6% |
| British | 99.9 /100 | #57 | Exceptional 4.6% |
| Immigrants | India | 99.8 /100 | #58 | Exceptional 4.6% |
| Swiss | 99.8 /100 | #59 | Exceptional 4.6% |
| Puget Sound Salish | 99.8 /100 | #60 | Exceptional 4.6% |
| Lebanese | 99.8 /100 | #61 | Exceptional 4.6% |
| Senegalese | 99.7 /100 | #62 | Exceptional 4.6% |
| Czechoslovakians | 99.7 /100 | #63 | Exceptional 4.6% |
| Immigrants | Middle Africa | 99.7 /100 | #64 | Exceptional 4.6% |
| Jordanians | 99.7 /100 | #65 | Exceptional 4.6% |
| Hawaiians | 99.6 /100 | #66 | Exceptional 4.6% |
| Immigrants | Scotland | 99.6 /100 | #67 | Exceptional 4.6% |
| Immigrants | Laos | 99.6 /100 | #68 | Exceptional 4.6% |
| Creek | 99.6 /100 | #69 | Exceptional 4.6% |
| Croatians | 99.5 /100 | #70 | Exceptional 4.6% |
| Slavs | 99.5 /100 | #71 | Exceptional 4.6% |
| Tongans | 99.5 /100 | #72 | Exceptional 4.6% |