Spanish American Indian vs Syrian Unemployment Among Youth under 25 years
COMPARE
Spanish American Indian
Syrian
Unemployment Among Youth under 25 years
Unemployment Among Youth under 25 years Comparison
Spanish American Indians
Syrians
13.5%
UNEMPLOYMENT AMONG YOUTH UNDER 25 YEARS
0.0/ 100
METRIC RATING
293rd/ 347
METRIC RANK
11.7%
UNEMPLOYMENT AMONG YOUTH UNDER 25 YEARS
38.4/ 100
METRIC RATING
181st/ 347
METRIC RANK
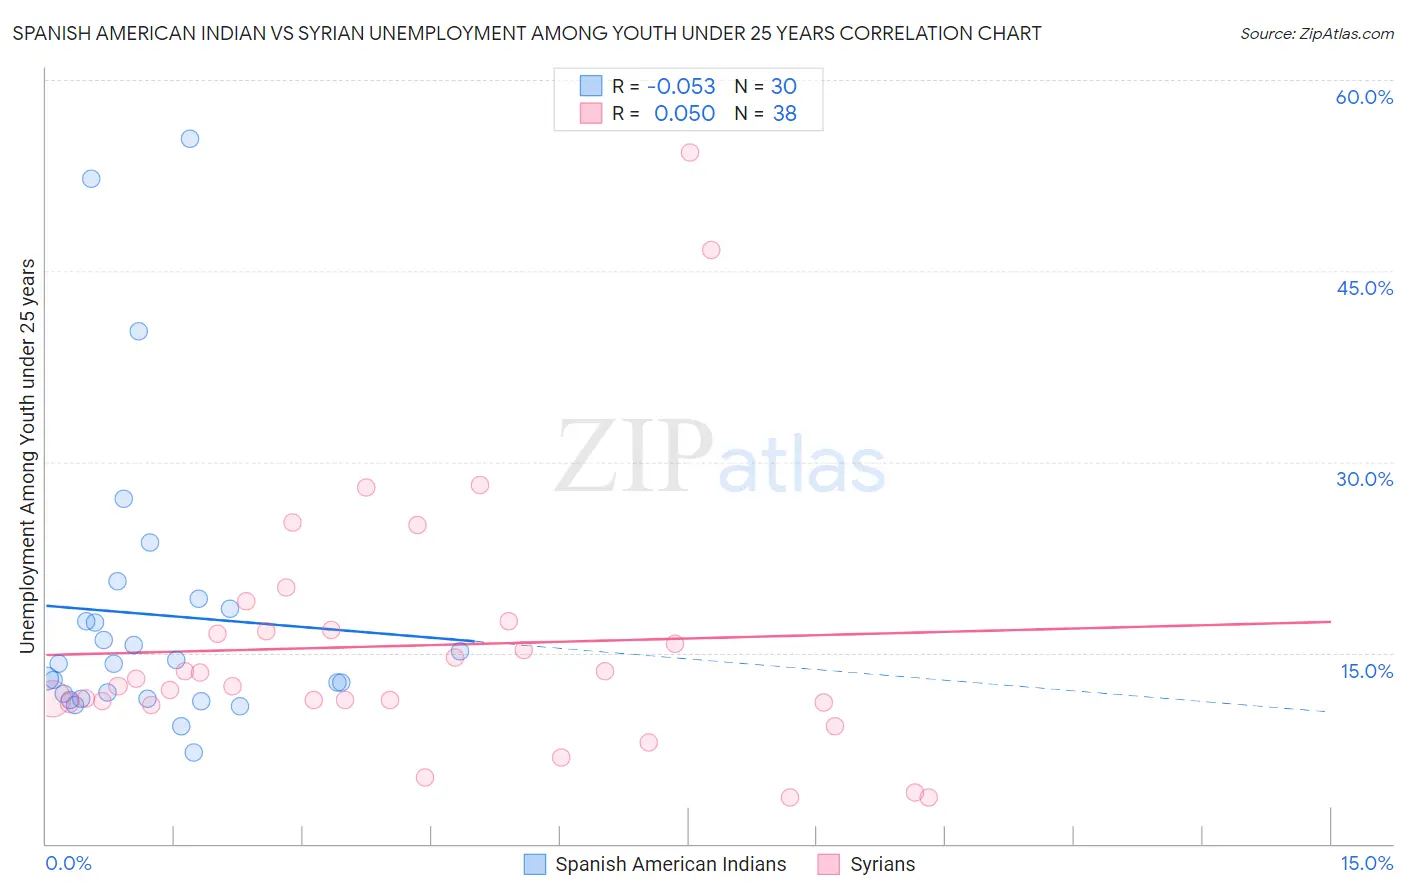
Spanish American Indian vs Syrian Unemployment Among Youth under 25 years Correlation Chart
The statistical analysis conducted on geographies consisting of 73,037,062 people shows a slight negative correlation between the proportion of Spanish American Indians and unemployment rate among youth under the age of 25 in the United States with a correlation coefficient (R) of -0.053 and weighted average of 13.5%. Similarly, the statistical analysis conducted on geographies consisting of 264,359,059 people shows a slight positive correlation between the proportion of Syrians and unemployment rate among youth under the age of 25 in the United States with a correlation coefficient (R) of 0.050 and weighted average of 11.7%, a difference of 15.6%.
Unemployment Among Youth under 25 years Correlation Summary
| Measurement | Spanish American Indian | Syrian |
| Minimum | 7.2% | 3.6% |
| Maximum | 55.4% | 54.3% |
| Range | 48.2% | 50.7% |
| Mean | 18.0% | 15.6% |
| Median | 14.1% | 12.7% |
| Interquartile 25% (IQ1) | 11.4% | 11.1% |
| Interquartile 75% (IQ3) | 18.5% | 16.8% |
| Interquartile Range (IQR) | 7.0% | 5.7% |
| Standard Deviation (Sample) | 11.6% | 10.3% |
| Standard Deviation (Population) | 11.4% | 10.2% |
Similar Demographics by Unemployment Among Youth under 25 years
Demographics Similar to Spanish American Indians by Unemployment Among Youth under 25 years
In terms of unemployment among youth under 25 years, the demographic groups most similar to Spanish American Indians are Central American Indian (13.5%, a difference of 0.11%), Apache (13.5%, a difference of 0.14%), Immigrants from Caribbean (13.5%, a difference of 0.16%), Immigrants from Ecuador (13.4%, a difference of 0.40%), and Chippewa (13.5%, a difference of 0.40%).
| Demographics | Rating | Rank | Unemployment Among Youth under 25 years |
| Blackfeet | 0.0 /100 | #286 | Tragic 13.3% |
| Ecuadorians | 0.0 /100 | #287 | Tragic 13.3% |
| Immigrants | Western Africa | 0.0 /100 | #288 | Tragic 13.4% |
| Immigrants | Ghana | 0.0 /100 | #289 | Tragic 13.4% |
| Immigrants | Ecuador | 0.0 /100 | #290 | Tragic 13.4% |
| Apache | 0.0 /100 | #291 | Tragic 13.5% |
| Central American Indians | 0.0 /100 | #292 | Tragic 13.5% |
| Spanish American Indians | 0.0 /100 | #293 | Tragic 13.5% |
| Immigrants | Caribbean | 0.0 /100 | #294 | Tragic 13.5% |
| Chippewa | 0.0 /100 | #295 | Tragic 13.5% |
| Senegalese | 0.0 /100 | #296 | Tragic 13.5% |
| U.S. Virgin Islanders | 0.0 /100 | #297 | Tragic 13.6% |
| Shoshone | 0.0 /100 | #298 | Tragic 13.7% |
| Tohono O'odham | 0.0 /100 | #299 | Tragic 13.8% |
| Immigrants | Cabo Verde | 0.0 /100 | #300 | Tragic 13.8% |
Demographics Similar to Syrians by Unemployment Among Youth under 25 years
In terms of unemployment among youth under 25 years, the demographic groups most similar to Syrians are Spaniard (11.7%, a difference of 0.060%), Immigrants from Italy (11.7%, a difference of 0.10%), Immigrants from Europe (11.6%, a difference of 0.17%), Immigrants from Hong Kong (11.6%, a difference of 0.17%), and American (11.7%, a difference of 0.18%).
| Demographics | Rating | Rank | Unemployment Among Youth under 25 years |
| Immigrants | China | 50.0 /100 | #174 | Average 11.6% |
| Immigrants | Iraq | 47.0 /100 | #175 | Average 11.6% |
| Ugandans | 45.6 /100 | #176 | Average 11.6% |
| Immigrants | Denmark | 45.0 /100 | #177 | Average 11.6% |
| Immigrants | Europe | 42.4 /100 | #178 | Average 11.6% |
| Immigrants | Hong Kong | 42.4 /100 | #179 | Average 11.6% |
| Spaniards | 39.8 /100 | #180 | Fair 11.7% |
| Syrians | 38.4 /100 | #181 | Fair 11.7% |
| Immigrants | Italy | 36.2 /100 | #182 | Fair 11.7% |
| Americans | 34.5 /100 | #183 | Fair 11.7% |
| Immigrants | Eastern Europe | 34.1 /100 | #184 | Fair 11.7% |
| French American Indians | 34.0 /100 | #185 | Fair 11.7% |
| Maltese | 33.9 /100 | #186 | Fair 11.7% |
| Immigrants | Egypt | 31.9 /100 | #187 | Fair 11.7% |
| Immigrants | Poland | 31.4 /100 | #188 | Fair 11.7% |