Spaniard vs Swedish Unemployment Among Ages 55 to 59 years
COMPARE
Spaniard
Swedish
Unemployment Among Ages 55 to 59 years
Unemployment Among Ages 55 to 59 years Comparison
Spaniards
Swedes
4.9%
UNEMPLOYMENT AMONG AGES 55 TO 59 YEARS
27.2/ 100
METRIC RATING
194th/ 347
METRIC RANK
4.4%
UNEMPLOYMENT AMONG AGES 55 TO 59 YEARS
100.0/ 100
METRIC RATING
20th/ 347
METRIC RANK
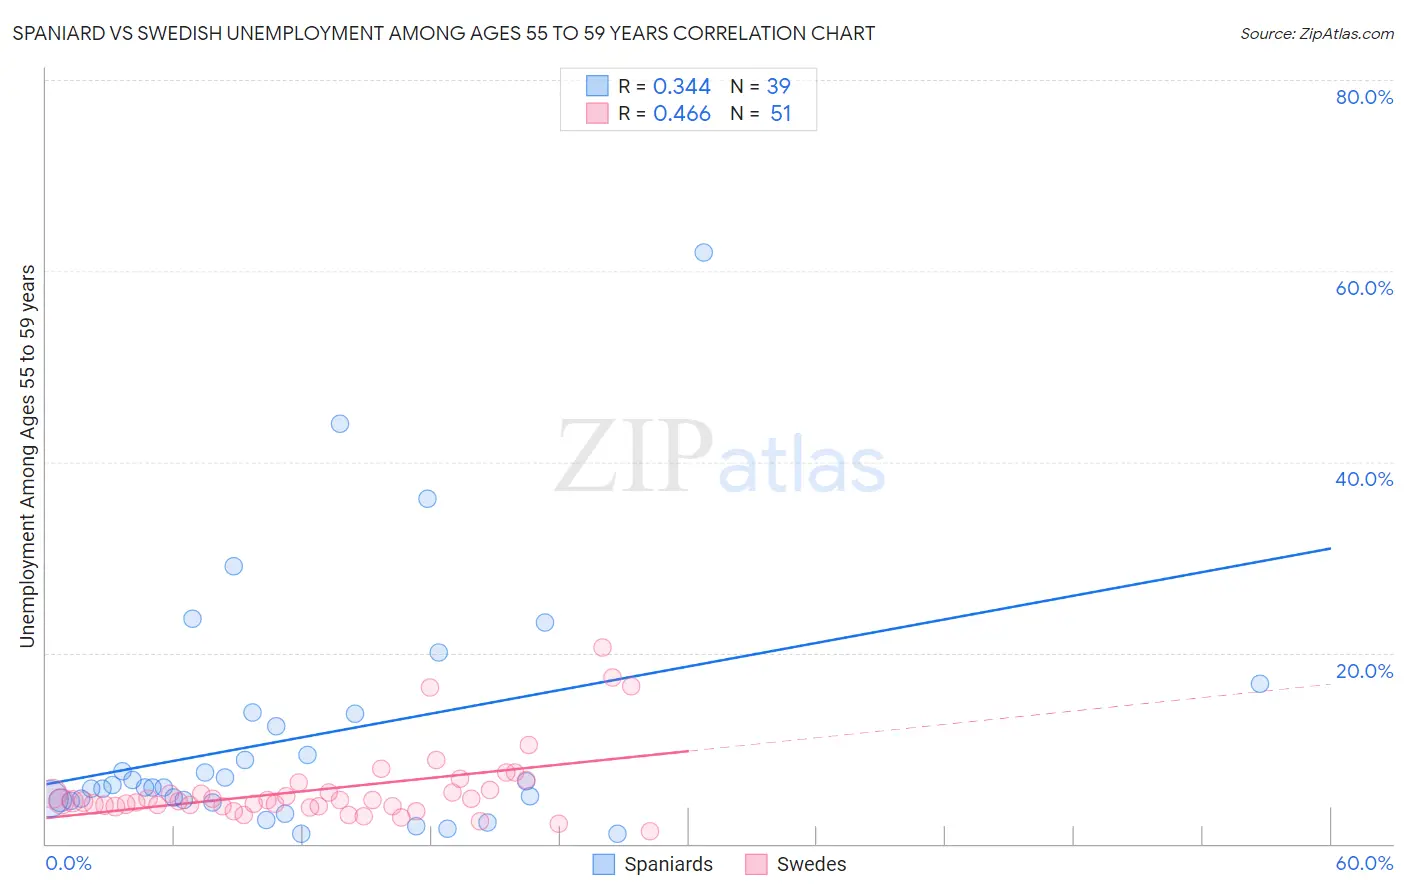
Spaniard vs Swedish Unemployment Among Ages 55 to 59 years Correlation Chart
The statistical analysis conducted on geographies consisting of 407,102,056 people shows a mild positive correlation between the proportion of Spaniards and unemployment rate among population between the ages 55 and 59 in the United States with a correlation coefficient (R) of 0.344 and weighted average of 4.9%. Similarly, the statistical analysis conducted on geographies consisting of 467,636,528 people shows a moderate positive correlation between the proportion of Swedes and unemployment rate among population between the ages 55 and 59 in the United States with a correlation coefficient (R) of 0.466 and weighted average of 4.4%, a difference of 10.4%.
Unemployment Among Ages 55 to 59 years Correlation Summary
| Measurement | Spaniard | Swedish |
| Minimum | 1.1% | 1.3% |
| Maximum | 61.9% | 20.5% |
| Range | 60.8% | 19.2% |
| Mean | 11.1% | 5.7% |
| Median | 5.9% | 4.5% |
| Interquartile 25% (IQ1) | 4.5% | 3.9% |
| Interquartile 75% (IQ3) | 13.6% | 5.6% |
| Interquartile Range (IQR) | 9.1% | 1.7% |
| Standard Deviation (Sample) | 12.8% | 3.9% |
| Standard Deviation (Population) | 12.6% | 3.9% |
Similar Demographics by Unemployment Among Ages 55 to 59 years
Demographics Similar to Spaniards by Unemployment Among Ages 55 to 59 years
In terms of unemployment among ages 55 to 59 years, the demographic groups most similar to Spaniards are Estonian (4.9%, a difference of 0.0%), Eastern European (4.9%, a difference of 0.030%), Macedonian (4.9%, a difference of 0.040%), Immigrants from Philippines (4.9%, a difference of 0.050%), and Immigrants from Italy (4.9%, a difference of 0.14%).
| Demographics | Rating | Rank | Unemployment Among Ages 55 to 59 years |
| Immigrants | Morocco | 36.5 /100 | #187 | Fair 4.8% |
| Immigrants | Eastern Asia | 36.1 /100 | #188 | Fair 4.8% |
| Iroquois | 34.5 /100 | #189 | Fair 4.9% |
| Russians | 33.9 /100 | #190 | Fair 4.9% |
| Iranians | 32.4 /100 | #191 | Fair 4.9% |
| Immigrants | Ukraine | 31.7 /100 | #192 | Fair 4.9% |
| Immigrants | Italy | 30.1 /100 | #193 | Fair 4.9% |
| Spaniards | 27.2 /100 | #194 | Fair 4.9% |
| Estonians | 27.2 /100 | #195 | Fair 4.9% |
| Eastern Europeans | 26.7 /100 | #196 | Fair 4.9% |
| Macedonians | 26.4 /100 | #197 | Fair 4.9% |
| Immigrants | Philippines | 26.1 /100 | #198 | Fair 4.9% |
| Immigrants | Russia | 23.7 /100 | #199 | Fair 4.9% |
| Basques | 23.3 /100 | #200 | Fair 4.9% |
| Immigrants | South America | 23.1 /100 | #201 | Fair 4.9% |
Demographics Similar to Swedes by Unemployment Among Ages 55 to 59 years
In terms of unemployment among ages 55 to 59 years, the demographic groups most similar to Swedes are Chinese (4.4%, a difference of 0.12%), Puget Sound Salish (4.4%, a difference of 0.15%), Immigrants from Somalia (4.4%, a difference of 0.22%), Immigrants from Burma/Myanmar (4.4%, a difference of 0.24%), and Kenyan (4.4%, a difference of 0.50%).
| Demographics | Rating | Rank | Unemployment Among Ages 55 to 59 years |
| Indonesians | 100.0 /100 | #13 | Exceptional 4.3% |
| Immigrants | India | 100.0 /100 | #14 | Exceptional 4.3% |
| Bulgarians | 100.0 /100 | #15 | Exceptional 4.3% |
| Somalis | 100.0 /100 | #16 | Exceptional 4.4% |
| Czechs | 100.0 /100 | #17 | Exceptional 4.4% |
| Immigrants | Somalia | 100.0 /100 | #18 | Exceptional 4.4% |
| Chinese | 100.0 /100 | #19 | Exceptional 4.4% |
| Swedes | 100.0 /100 | #20 | Exceptional 4.4% |
| Puget Sound Salish | 100.0 /100 | #21 | Exceptional 4.4% |
| Immigrants | Burma/Myanmar | 100.0 /100 | #22 | Exceptional 4.4% |
| Kenyans | 100.0 /100 | #23 | Exceptional 4.4% |
| Jordanians | 100.0 /100 | #24 | Exceptional 4.4% |
| Immigrants | Eritrea | 100.0 /100 | #25 | Exceptional 4.4% |
| Scandinavians | 99.9 /100 | #26 | Exceptional 4.5% |
| Immigrants | Zimbabwe | 99.9 /100 | #27 | Exceptional 4.5% |