Ute vs Swedish Unemployment Among Ages 55 to 59 years
COMPARE
Ute
Swedish
Unemployment Among Ages 55 to 59 years
Unemployment Among Ages 55 to 59 years Comparison
Ute
Swedes
5.2%
UNEMPLOYMENT AMONG AGES 55 TO 59 YEARS
0.1/ 100
METRIC RATING
270th/ 347
METRIC RANK
4.4%
UNEMPLOYMENT AMONG AGES 55 TO 59 YEARS
100.0/ 100
METRIC RATING
20th/ 347
METRIC RANK
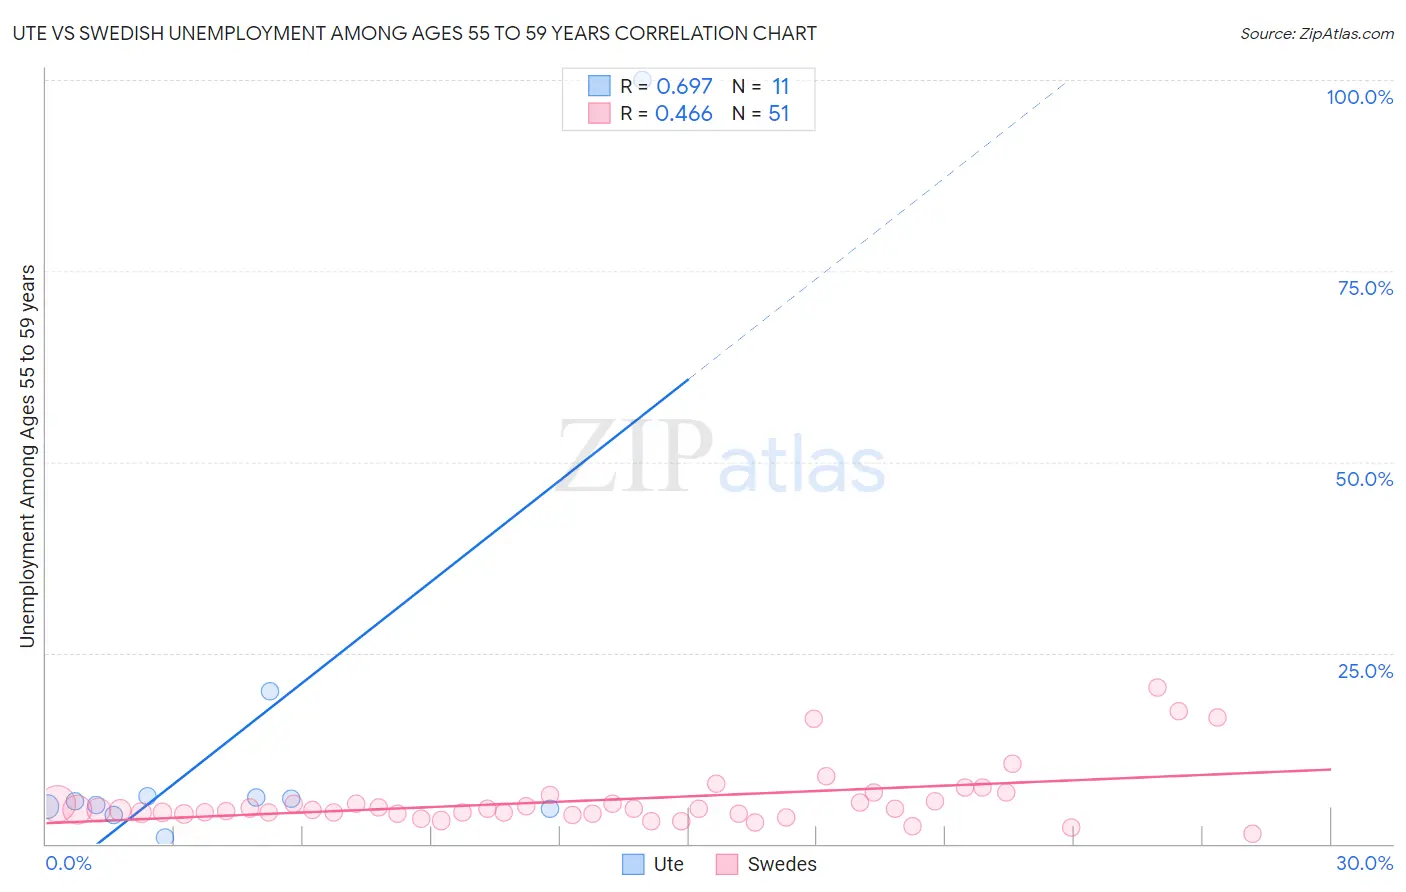
Ute vs Swedish Unemployment Among Ages 55 to 59 years Correlation Chart
The statistical analysis conducted on geographies consisting of 54,614,503 people shows a significant positive correlation between the proportion of Ute and unemployment rate among population between the ages 55 and 59 in the United States with a correlation coefficient (R) of 0.697 and weighted average of 5.2%. Similarly, the statistical analysis conducted on geographies consisting of 467,636,528 people shows a moderate positive correlation between the proportion of Swedes and unemployment rate among population between the ages 55 and 59 in the United States with a correlation coefficient (R) of 0.466 and weighted average of 4.4%, a difference of 17.3%.
Unemployment Among Ages 55 to 59 years Correlation Summary
| Measurement | Ute | Swedish |
| Minimum | 0.80% | 1.3% |
| Maximum | 100.0% | 20.5% |
| Range | 99.2% | 19.2% |
| Mean | 14.8% | 5.7% |
| Median | 5.6% | 4.5% |
| Interquartile 25% (IQ1) | 4.6% | 3.9% |
| Interquartile 75% (IQ3) | 6.2% | 5.6% |
| Interquartile Range (IQR) | 1.6% | 1.7% |
| Standard Deviation (Sample) | 28.7% | 3.9% |
| Standard Deviation (Population) | 27.3% | 3.9% |
Similar Demographics by Unemployment Among Ages 55 to 59 years
Demographics Similar to Ute by Unemployment Among Ages 55 to 59 years
In terms of unemployment among ages 55 to 59 years, the demographic groups most similar to Ute are Tsimshian (5.2%, a difference of 0.17%), Mexican (5.2%, a difference of 0.19%), Immigrants from Senegal (5.2%, a difference of 0.20%), Jamaican (5.2%, a difference of 0.21%), and Yaqui (5.2%, a difference of 0.24%).
| Demographics | Rating | Rank | Unemployment Among Ages 55 to 59 years |
| Immigrants | Sierra Leone | 0.1 /100 | #263 | Tragic 5.2% |
| Immigrants | Caribbean | 0.1 /100 | #264 | Tragic 5.2% |
| Yaqui | 0.1 /100 | #265 | Tragic 5.2% |
| Jamaicans | 0.1 /100 | #266 | Tragic 5.2% |
| Immigrants | Senegal | 0.1 /100 | #267 | Tragic 5.2% |
| Mexicans | 0.1 /100 | #268 | Tragic 5.2% |
| Tsimshian | 0.1 /100 | #269 | Tragic 5.2% |
| Ute | 0.1 /100 | #270 | Tragic 5.2% |
| Cree | 0.1 /100 | #271 | Tragic 5.2% |
| Immigrants | Jamaica | 0.0 /100 | #272 | Tragic 5.2% |
| Ottawa | 0.0 /100 | #273 | Tragic 5.2% |
| Mexican American Indians | 0.0 /100 | #274 | Tragic 5.2% |
| Israelis | 0.0 /100 | #275 | Tragic 5.2% |
| West Indians | 0.0 /100 | #276 | Tragic 5.2% |
| Immigrants | Latin America | 0.0 /100 | #277 | Tragic 5.2% |
Demographics Similar to Swedes by Unemployment Among Ages 55 to 59 years
In terms of unemployment among ages 55 to 59 years, the demographic groups most similar to Swedes are Chinese (4.4%, a difference of 0.12%), Puget Sound Salish (4.4%, a difference of 0.15%), Immigrants from Somalia (4.4%, a difference of 0.22%), Immigrants from Burma/Myanmar (4.4%, a difference of 0.24%), and Kenyan (4.4%, a difference of 0.50%).
| Demographics | Rating | Rank | Unemployment Among Ages 55 to 59 years |
| Indonesians | 100.0 /100 | #13 | Exceptional 4.3% |
| Immigrants | India | 100.0 /100 | #14 | Exceptional 4.3% |
| Bulgarians | 100.0 /100 | #15 | Exceptional 4.3% |
| Somalis | 100.0 /100 | #16 | Exceptional 4.4% |
| Czechs | 100.0 /100 | #17 | Exceptional 4.4% |
| Immigrants | Somalia | 100.0 /100 | #18 | Exceptional 4.4% |
| Chinese | 100.0 /100 | #19 | Exceptional 4.4% |
| Swedes | 100.0 /100 | #20 | Exceptional 4.4% |
| Puget Sound Salish | 100.0 /100 | #21 | Exceptional 4.4% |
| Immigrants | Burma/Myanmar | 100.0 /100 | #22 | Exceptional 4.4% |
| Kenyans | 100.0 /100 | #23 | Exceptional 4.4% |
| Jordanians | 100.0 /100 | #24 | Exceptional 4.4% |
| Immigrants | Eritrea | 100.0 /100 | #25 | Exceptional 4.4% |
| Scandinavians | 99.9 /100 | #26 | Exceptional 4.5% |
| Immigrants | Zimbabwe | 99.9 /100 | #27 | Exceptional 4.5% |