Soviet Union vs Bahamian Unemployment Among Seniors over 75 years
COMPARE
Soviet Union
Bahamian
Unemployment Among Seniors over 75 years
Unemployment Among Seniors over 75 years Comparison
Soviet Union
Bahamians
6.6%
UNEMPLOYMENT AMONG SENIORS OVER 75 YEARS
100.0/ 100
METRIC RATING
9th/ 347
METRIC RANK
7.8%
UNEMPLOYMENT AMONG SENIORS OVER 75 YEARS
100.0/ 100
METRIC RATING
52nd/ 347
METRIC RANK
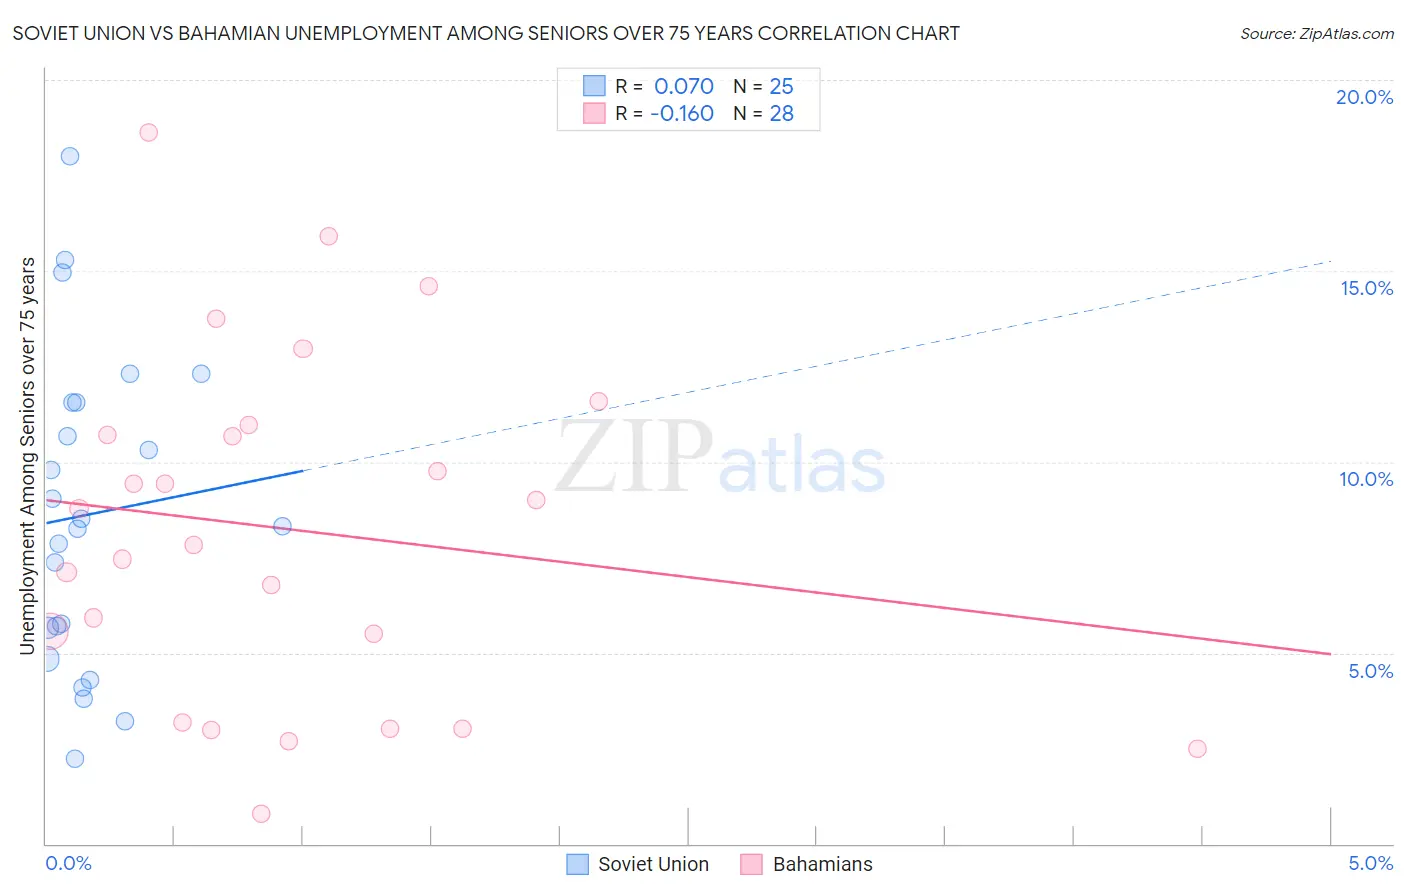
Soviet Union vs Bahamian Unemployment Among Seniors over 75 years Correlation Chart
The statistical analysis conducted on geographies consisting of 39,610,083 people shows a slight positive correlation between the proportion of Soviet Union and unemployment rate among seniors over the age of 75 in the United States with a correlation coefficient (R) of 0.070 and weighted average of 6.6%. Similarly, the statistical analysis conducted on geographies consisting of 79,279,654 people shows a poor negative correlation between the proportion of Bahamians and unemployment rate among seniors over the age of 75 in the United States with a correlation coefficient (R) of -0.160 and weighted average of 7.8%, a difference of 18.1%.
Unemployment Among Seniors over 75 years Correlation Summary
| Measurement | Soviet Union | Bahamian |
| Minimum | 2.2% | 0.80% |
| Maximum | 18.0% | 18.6% |
| Range | 15.8% | 17.8% |
| Mean | 8.6% | 8.2% |
| Median | 8.3% | 8.3% |
| Interquartile 25% (IQ1) | 5.2% | 4.3% |
| Interquartile 75% (IQ3) | 11.6% | 10.8% |
| Interquartile Range (IQR) | 6.3% | 6.5% |
| Standard Deviation (Sample) | 4.1% | 4.5% |
| Standard Deviation (Population) | 4.0% | 4.4% |
Similar Demographics by Unemployment Among Seniors over 75 years
Demographics Similar to Soviet Union by Unemployment Among Seniors over 75 years
In terms of unemployment among seniors over 75 years, the demographic groups most similar to Soviet Union are Yuman (6.7%, a difference of 0.22%), Immigrants from Grenada (6.7%, a difference of 0.31%), Comanche (6.7%, a difference of 0.45%), Immigrants from Congo (6.7%, a difference of 1.3%), and Taiwanese (6.6%, a difference of 1.3%).
| Demographics | Rating | Rank | Unemployment Among Seniors over 75 years |
| Chinese | 100.0 /100 | #2 | Exceptional 5.9% |
| Cheyenne | 100.0 /100 | #3 | Exceptional 5.9% |
| Alsatians | 100.0 /100 | #4 | Exceptional 6.1% |
| Hopi | 100.0 /100 | #5 | Exceptional 6.3% |
| Immigrants | Armenia | 100.0 /100 | #6 | Exceptional 6.5% |
| Spanish American Indians | 100.0 /100 | #7 | Exceptional 6.5% |
| Taiwanese | 100.0 /100 | #8 | Exceptional 6.6% |
| Soviet Union | 100.0 /100 | #9 | Exceptional 6.6% |
| Yuman | 100.0 /100 | #10 | Exceptional 6.7% |
| Immigrants | Grenada | 100.0 /100 | #11 | Exceptional 6.7% |
| Comanche | 100.0 /100 | #12 | Exceptional 6.7% |
| Immigrants | Congo | 100.0 /100 | #13 | Exceptional 6.7% |
| Ute | 100.0 /100 | #14 | Exceptional 6.8% |
| Icelanders | 100.0 /100 | #15 | Exceptional 7.0% |
| Seminole | 100.0 /100 | #16 | Exceptional 7.1% |
Demographics Similar to Bahamians by Unemployment Among Seniors over 75 years
In terms of unemployment among seniors over 75 years, the demographic groups most similar to Bahamians are Immigrants from Egypt (7.9%, a difference of 0.070%), Immigrants from Malaysia (7.9%, a difference of 0.10%), Moroccan (7.8%, a difference of 0.24%), Immigrants from Latvia (7.8%, a difference of 0.30%), and Potawatomi (7.8%, a difference of 0.32%).
| Demographics | Rating | Rank | Unemployment Among Seniors over 75 years |
| British West Indians | 100.0 /100 | #45 | Exceptional 7.8% |
| Immigrants | China | 100.0 /100 | #46 | Exceptional 7.8% |
| Creek | 100.0 /100 | #47 | Exceptional 7.8% |
| Immigrants | Chile | 100.0 /100 | #48 | Exceptional 7.8% |
| Potawatomi | 100.0 /100 | #49 | Exceptional 7.8% |
| Immigrants | Latvia | 100.0 /100 | #50 | Exceptional 7.8% |
| Moroccans | 100.0 /100 | #51 | Exceptional 7.8% |
| Bahamians | 100.0 /100 | #52 | Exceptional 7.8% |
| Immigrants | Egypt | 100.0 /100 | #53 | Exceptional 7.9% |
| Immigrants | Malaysia | 99.9 /100 | #54 | Exceptional 7.9% |
| Filipinos | 99.9 /100 | #55 | Exceptional 7.9% |
| Immigrants | Eastern Asia | 99.9 /100 | #56 | Exceptional 7.9% |
| Ottawa | 99.9 /100 | #57 | Exceptional 7.9% |
| Iranians | 99.9 /100 | #58 | Exceptional 7.9% |
| Indonesians | 99.9 /100 | #59 | Exceptional 7.9% |