Immigrants from Moldova vs Bahamian Unemployment Among Seniors over 75 years
COMPARE
Immigrants from Moldova
Bahamian
Unemployment Among Seniors over 75 years
Unemployment Among Seniors over 75 years Comparison
Immigrants from Moldova
Bahamians
8.3%
UNEMPLOYMENT AMONG SENIORS OVER 75 YEARS
96.7/ 100
METRIC RATING
125th/ 347
METRIC RANK
7.8%
UNEMPLOYMENT AMONG SENIORS OVER 75 YEARS
100.0/ 100
METRIC RATING
52nd/ 347
METRIC RANK
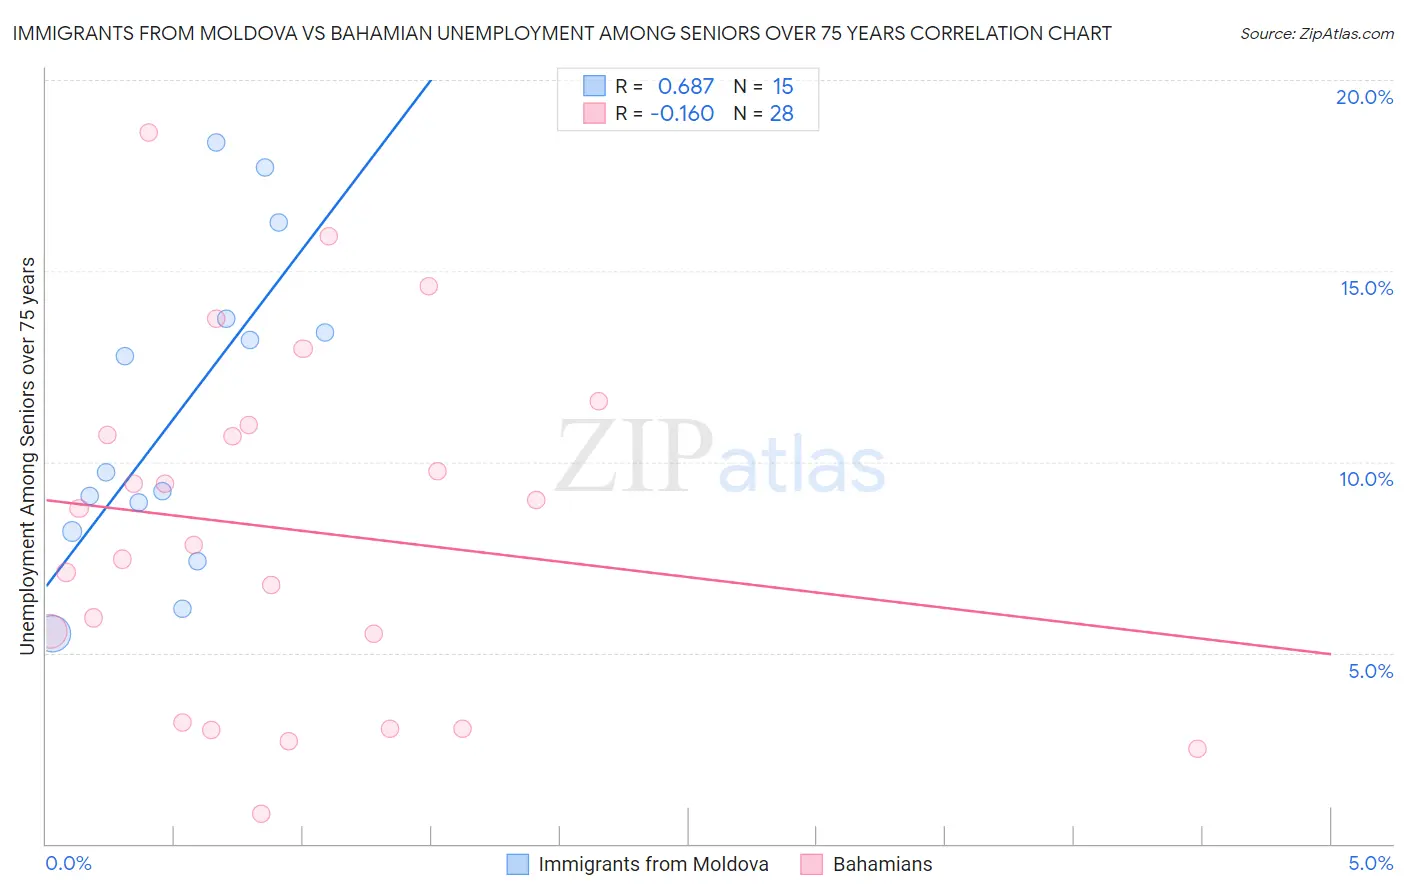
Immigrants from Moldova vs Bahamian Unemployment Among Seniors over 75 years Correlation Chart
The statistical analysis conducted on geographies consisting of 89,734,625 people shows a significant positive correlation between the proportion of Immigrants from Moldova and unemployment rate among seniors over the age of 75 in the United States with a correlation coefficient (R) of 0.687 and weighted average of 8.3%. Similarly, the statistical analysis conducted on geographies consisting of 79,279,654 people shows a poor negative correlation between the proportion of Bahamians and unemployment rate among seniors over the age of 75 in the United States with a correlation coefficient (R) of -0.160 and weighted average of 7.8%, a difference of 6.4%.
Unemployment Among Seniors over 75 years Correlation Summary
| Measurement | Immigrants from Moldova | Bahamian |
| Minimum | 5.5% | 0.80% |
| Maximum | 18.4% | 18.6% |
| Range | 12.9% | 17.8% |
| Mean | 11.3% | 8.2% |
| Median | 9.7% | 8.3% |
| Interquartile 25% (IQ1) | 8.2% | 4.3% |
| Interquartile 75% (IQ3) | 13.7% | 10.8% |
| Interquartile Range (IQR) | 5.6% | 6.5% |
| Standard Deviation (Sample) | 4.1% | 4.5% |
| Standard Deviation (Population) | 3.9% | 4.4% |
Similar Demographics by Unemployment Among Seniors over 75 years
Demographics Similar to Immigrants from Moldova by Unemployment Among Seniors over 75 years
In terms of unemployment among seniors over 75 years, the demographic groups most similar to Immigrants from Moldova are Thai (8.3%, a difference of 0.020%), Immigrants from Nepal (8.3%, a difference of 0.060%), Immigrants from Russia (8.3%, a difference of 0.14%), Belizean (8.4%, a difference of 0.20%), and Immigrants from Croatia (8.3%, a difference of 0.21%).
| Demographics | Rating | Rank | Unemployment Among Seniors over 75 years |
| Immigrants | Middle Africa | 97.9 /100 | #118 | Exceptional 8.3% |
| Japanese | 97.5 /100 | #119 | Exceptional 8.3% |
| Immigrants | Asia | 97.4 /100 | #120 | Exceptional 8.3% |
| Immigrants | Croatia | 97.2 /100 | #121 | Exceptional 8.3% |
| Immigrants | Russia | 97.1 /100 | #122 | Exceptional 8.3% |
| Immigrants | Nepal | 96.9 /100 | #123 | Exceptional 8.3% |
| Thais | 96.8 /100 | #124 | Exceptional 8.3% |
| Immigrants | Moldova | 96.7 /100 | #125 | Exceptional 8.3% |
| Belizeans | 96.3 /100 | #126 | Exceptional 8.4% |
| Hondurans | 96.2 /100 | #127 | Exceptional 8.4% |
| Native Hawaiians | 96.1 /100 | #128 | Exceptional 8.4% |
| Ghanaians | 96.0 /100 | #129 | Exceptional 8.4% |
| Apache | 95.2 /100 | #130 | Exceptional 8.4% |
| German Russians | 94.9 /100 | #131 | Exceptional 8.4% |
| Chileans | 93.8 /100 | #132 | Exceptional 8.4% |
Demographics Similar to Bahamians by Unemployment Among Seniors over 75 years
In terms of unemployment among seniors over 75 years, the demographic groups most similar to Bahamians are Immigrants from Egypt (7.9%, a difference of 0.070%), Immigrants from Malaysia (7.9%, a difference of 0.10%), Moroccan (7.8%, a difference of 0.24%), Immigrants from Latvia (7.8%, a difference of 0.30%), and Potawatomi (7.8%, a difference of 0.32%).
| Demographics | Rating | Rank | Unemployment Among Seniors over 75 years |
| British West Indians | 100.0 /100 | #45 | Exceptional 7.8% |
| Immigrants | China | 100.0 /100 | #46 | Exceptional 7.8% |
| Creek | 100.0 /100 | #47 | Exceptional 7.8% |
| Immigrants | Chile | 100.0 /100 | #48 | Exceptional 7.8% |
| Potawatomi | 100.0 /100 | #49 | Exceptional 7.8% |
| Immigrants | Latvia | 100.0 /100 | #50 | Exceptional 7.8% |
| Moroccans | 100.0 /100 | #51 | Exceptional 7.8% |
| Bahamians | 100.0 /100 | #52 | Exceptional 7.8% |
| Immigrants | Egypt | 100.0 /100 | #53 | Exceptional 7.9% |
| Immigrants | Malaysia | 99.9 /100 | #54 | Exceptional 7.9% |
| Filipinos | 99.9 /100 | #55 | Exceptional 7.9% |
| Immigrants | Eastern Asia | 99.9 /100 | #56 | Exceptional 7.9% |
| Ottawa | 99.9 /100 | #57 | Exceptional 7.9% |
| Iranians | 99.9 /100 | #58 | Exceptional 7.9% |
| Indonesians | 99.9 /100 | #59 | Exceptional 7.9% |