South African vs Immigrants from Senegal Unemployment Among Ages 45 to 54 years
COMPARE
South African
Immigrants from Senegal
Unemployment Among Ages 45 to 54 years
Unemployment Among Ages 45 to 54 years Comparison
South Africans
Immigrants from Senegal
4.4%
UNEMPLOYMENT AMONG AGES 45 TO 54 YEARS
90.4/ 100
METRIC RATING
117th/ 347
METRIC RANK
5.2%
UNEMPLOYMENT AMONG AGES 45 TO 54 YEARS
0.0/ 100
METRIC RATING
293rd/ 347
METRIC RANK
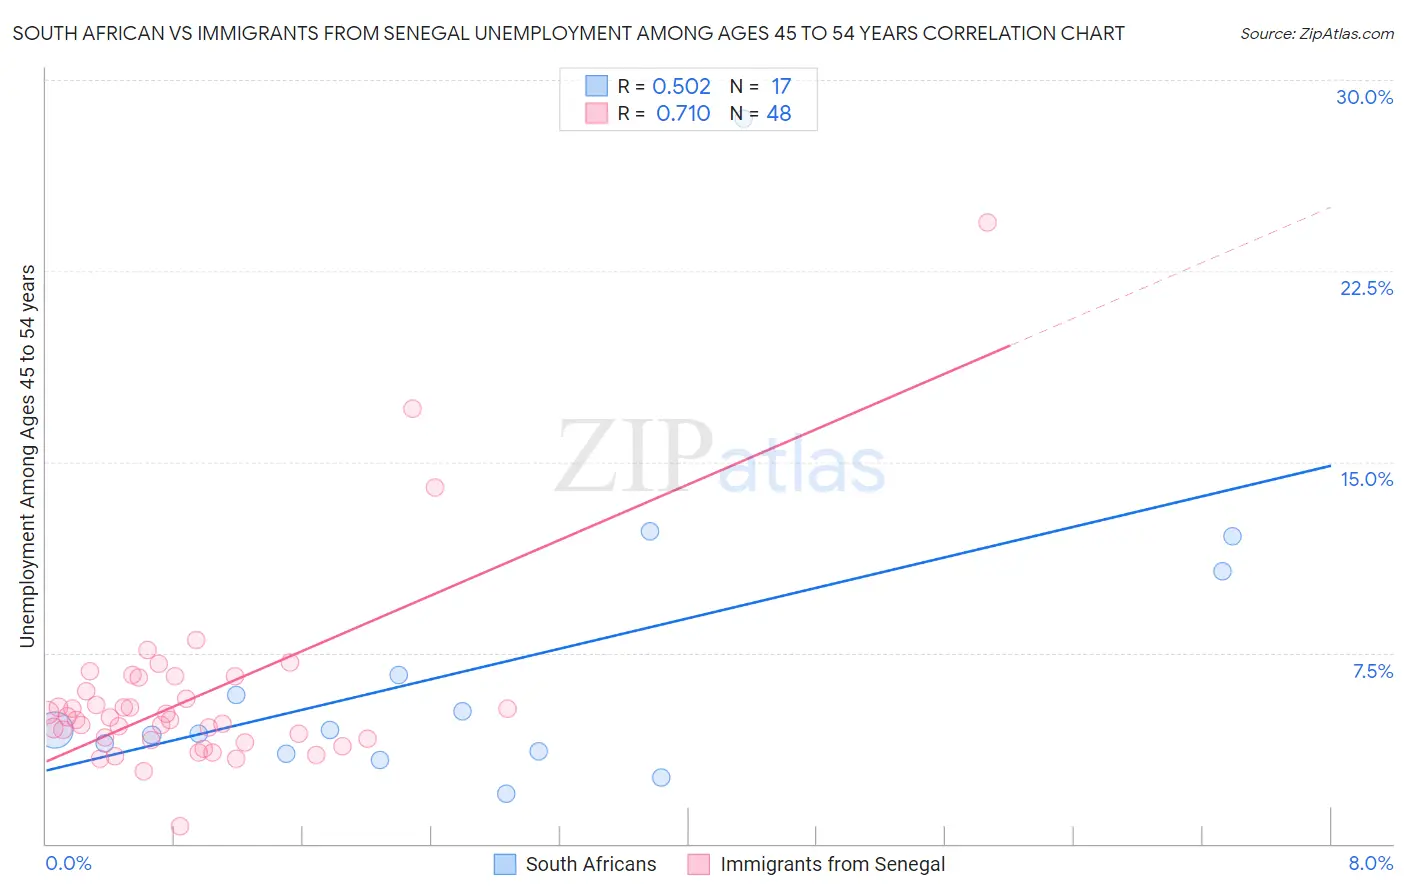
South African vs Immigrants from Senegal Unemployment Among Ages 45 to 54 years Correlation Chart
The statistical analysis conducted on geographies consisting of 180,291,072 people shows a substantial positive correlation between the proportion of South Africans and unemployment rate among population between the ages 45 and 54 in the United States with a correlation coefficient (R) of 0.502 and weighted average of 4.4%. Similarly, the statistical analysis conducted on geographies consisting of 89,667,130 people shows a strong positive correlation between the proportion of Immigrants from Senegal and unemployment rate among population between the ages 45 and 54 in the United States with a correlation coefficient (R) of 0.710 and weighted average of 5.2%, a difference of 18.5%.
Unemployment Among Ages 45 to 54 years Correlation Summary
| Measurement | South African | Immigrants from Senegal |
| Minimum | 2.0% | 0.70% |
| Maximum | 28.5% | 24.4% |
| Range | 26.5% | 23.7% |
| Mean | 6.9% | 5.8% |
| Median | 4.4% | 4.9% |
| Interquartile 25% (IQ1) | 3.6% | 4.1% |
| Interquartile 75% (IQ3) | 8.7% | 6.3% |
| Interquartile Range (IQR) | 5.1% | 2.2% |
| Standard Deviation (Sample) | 6.4% | 3.7% |
| Standard Deviation (Population) | 6.2% | 3.7% |
Similar Demographics by Unemployment Among Ages 45 to 54 years
Demographics Similar to South Africans by Unemployment Among Ages 45 to 54 years
In terms of unemployment among ages 45 to 54 years, the demographic groups most similar to South Africans are Immigrants from North Macedonia (4.4%, a difference of 0.030%), Pakistani (4.4%, a difference of 0.040%), Immigrants from Chile (4.4%, a difference of 0.060%), Immigrants from Romania (4.4%, a difference of 0.060%), and Native Hawaiian (4.4%, a difference of 0.070%).
| Demographics | Rating | Rank | Unemployment Among Ages 45 to 54 years |
| Immigrants | England | 91.3 /100 | #110 | Exceptional 4.4% |
| Immigrants | Nicaragua | 91.3 /100 | #111 | Exceptional 4.4% |
| Immigrants | Saudi Arabia | 91.1 /100 | #112 | Exceptional 4.4% |
| French Canadians | 91.0 /100 | #113 | Exceptional 4.4% |
| Immigrants | Chile | 90.9 /100 | #114 | Exceptional 4.4% |
| Pakistanis | 90.7 /100 | #115 | Exceptional 4.4% |
| Immigrants | North Macedonia | 90.6 /100 | #116 | Exceptional 4.4% |
| South Africans | 90.4 /100 | #117 | Exceptional 4.4% |
| Immigrants | Romania | 90.0 /100 | #118 | Exceptional 4.4% |
| Native Hawaiians | 90.0 /100 | #119 | Excellent 4.4% |
| Americans | 89.6 /100 | #120 | Excellent 4.4% |
| Immigrants | Oceania | 89.5 /100 | #121 | Excellent 4.4% |
| Immigrants | Kazakhstan | 89.5 /100 | #122 | Excellent 4.4% |
| Immigrants | Asia | 88.8 /100 | #123 | Excellent 4.4% |
| Spanish | 88.8 /100 | #124 | Excellent 4.4% |
Demographics Similar to Immigrants from Senegal by Unemployment Among Ages 45 to 54 years
In terms of unemployment among ages 45 to 54 years, the demographic groups most similar to Immigrants from Senegal are Trinidadian and Tobagonian (5.2%, a difference of 0.010%), Immigrants from Portugal (5.2%, a difference of 0.25%), Armenian (5.2%, a difference of 0.25%), Immigrants from Haiti (5.2%, a difference of 0.41%), and Belizean (5.2%, a difference of 0.58%).
| Demographics | Rating | Rank | Unemployment Among Ages 45 to 54 years |
| Senegalese | 0.0 /100 | #286 | Tragic 5.1% |
| Haitians | 0.0 /100 | #287 | Tragic 5.2% |
| Immigrants | Caribbean | 0.0 /100 | #288 | Tragic 5.2% |
| Immigrants | Haiti | 0.0 /100 | #289 | Tragic 5.2% |
| Immigrants | Portugal | 0.0 /100 | #290 | Tragic 5.2% |
| Armenians | 0.0 /100 | #291 | Tragic 5.2% |
| Trinidadians and Tobagonians | 0.0 /100 | #292 | Tragic 5.2% |
| Immigrants | Senegal | 0.0 /100 | #293 | Tragic 5.2% |
| Belizeans | 0.0 /100 | #294 | Tragic 5.2% |
| Jamaicans | 0.0 /100 | #295 | Tragic 5.3% |
| Aleuts | 0.0 /100 | #296 | Tragic 5.3% |
| West Indians | 0.0 /100 | #297 | Tragic 5.3% |
| Immigrants | Trinidad and Tobago | 0.0 /100 | #298 | Tragic 5.3% |
| Ecuadorians | 0.0 /100 | #299 | Tragic 5.3% |
| Central American Indians | 0.0 /100 | #300 | Tragic 5.3% |