Immigrants from Bolivia vs Immigrants from Senegal Unemployment Among Ages 45 to 54 years
COMPARE
Immigrants from Bolivia
Immigrants from Senegal
Unemployment Among Ages 45 to 54 years
Unemployment Among Ages 45 to 54 years Comparison
Immigrants from Bolivia
Immigrants from Senegal
4.0%
UNEMPLOYMENT AMONG AGES 45 TO 54 YEARS
100.0/ 100
METRIC RATING
15th/ 347
METRIC RANK
5.2%
UNEMPLOYMENT AMONG AGES 45 TO 54 YEARS
0.0/ 100
METRIC RATING
293rd/ 347
METRIC RANK
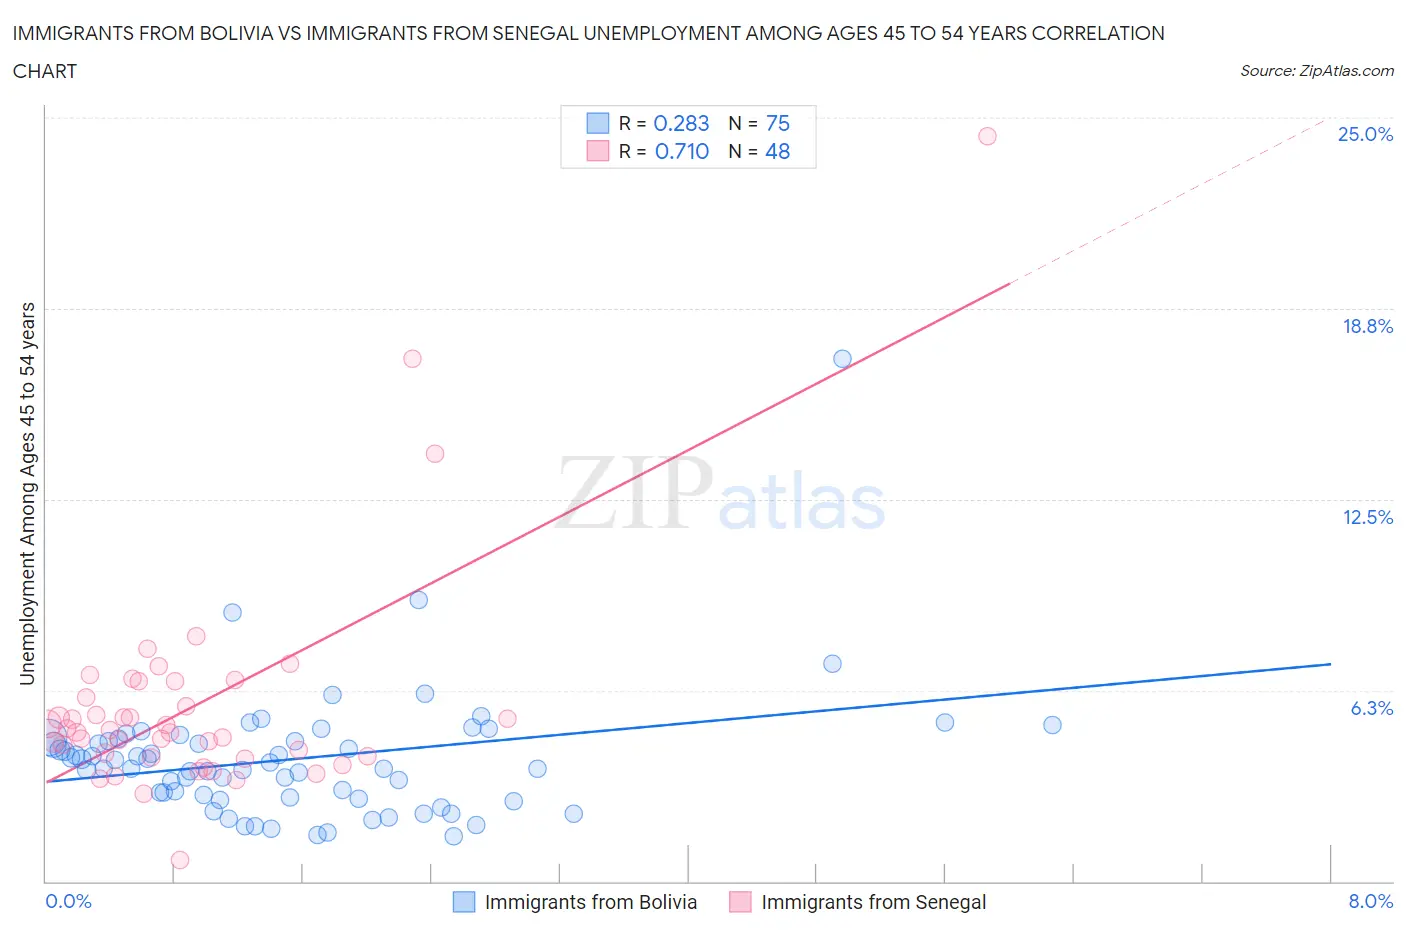
Immigrants from Bolivia vs Immigrants from Senegal Unemployment Among Ages 45 to 54 years Correlation Chart
The statistical analysis conducted on geographies consisting of 157,469,512 people shows a weak positive correlation between the proportion of Immigrants from Bolivia and unemployment rate among population between the ages 45 and 54 in the United States with a correlation coefficient (R) of 0.283 and weighted average of 4.0%. Similarly, the statistical analysis conducted on geographies consisting of 89,667,130 people shows a strong positive correlation between the proportion of Immigrants from Senegal and unemployment rate among population between the ages 45 and 54 in the United States with a correlation coefficient (R) of 0.710 and weighted average of 5.2%, a difference of 29.6%.
Unemployment Among Ages 45 to 54 years Correlation Summary
| Measurement | Immigrants from Bolivia | Immigrants from Senegal |
| Minimum | 1.5% | 0.70% |
| Maximum | 17.1% | 24.4% |
| Range | 15.6% | 23.7% |
| Mean | 4.0% | 5.8% |
| Median | 3.7% | 4.9% |
| Interquartile 25% (IQ1) | 2.8% | 4.1% |
| Interquartile 75% (IQ3) | 4.7% | 6.3% |
| Interquartile Range (IQR) | 1.9% | 2.2% |
| Standard Deviation (Sample) | 2.1% | 3.7% |
| Standard Deviation (Population) | 2.1% | 3.7% |
Similar Demographics by Unemployment Among Ages 45 to 54 years
Demographics Similar to Immigrants from Bolivia by Unemployment Among Ages 45 to 54 years
In terms of unemployment among ages 45 to 54 years, the demographic groups most similar to Immigrants from Bolivia are Thai (4.0%, a difference of 0.19%), Immigrants from Bosnia and Herzegovina (4.0%, a difference of 0.43%), Cuban (4.0%, a difference of 0.48%), Swedish (4.0%, a difference of 0.63%), and Scandinavian (4.0%, a difference of 0.65%).
| Demographics | Rating | Rank | Unemployment Among Ages 45 to 54 years |
| Chinese | 100.0 /100 | #8 | Exceptional 4.0% |
| Czechs | 100.0 /100 | #9 | Exceptional 4.0% |
| Venezuelans | 100.0 /100 | #10 | Exceptional 4.0% |
| Scandinavians | 100.0 /100 | #11 | Exceptional 4.0% |
| Swedes | 100.0 /100 | #12 | Exceptional 4.0% |
| Cubans | 100.0 /100 | #13 | Exceptional 4.0% |
| Immigrants | Bosnia and Herzegovina | 100.0 /100 | #14 | Exceptional 4.0% |
| Immigrants | Bolivia | 100.0 /100 | #15 | Exceptional 4.0% |
| Thais | 100.0 /100 | #16 | Exceptional 4.0% |
| Tongans | 100.0 /100 | #17 | Exceptional 4.1% |
| Germans | 100.0 /100 | #18 | Exceptional 4.1% |
| Swiss | 100.0 /100 | #19 | Exceptional 4.1% |
| English | 100.0 /100 | #20 | Exceptional 4.1% |
| Europeans | 100.0 /100 | #21 | Exceptional 4.1% |
| Yugoslavians | 100.0 /100 | #22 | Exceptional 4.1% |
Demographics Similar to Immigrants from Senegal by Unemployment Among Ages 45 to 54 years
In terms of unemployment among ages 45 to 54 years, the demographic groups most similar to Immigrants from Senegal are Trinidadian and Tobagonian (5.2%, a difference of 0.010%), Immigrants from Portugal (5.2%, a difference of 0.25%), Armenian (5.2%, a difference of 0.25%), Immigrants from Haiti (5.2%, a difference of 0.41%), and Belizean (5.2%, a difference of 0.58%).
| Demographics | Rating | Rank | Unemployment Among Ages 45 to 54 years |
| Senegalese | 0.0 /100 | #286 | Tragic 5.1% |
| Haitians | 0.0 /100 | #287 | Tragic 5.2% |
| Immigrants | Caribbean | 0.0 /100 | #288 | Tragic 5.2% |
| Immigrants | Haiti | 0.0 /100 | #289 | Tragic 5.2% |
| Immigrants | Portugal | 0.0 /100 | #290 | Tragic 5.2% |
| Armenians | 0.0 /100 | #291 | Tragic 5.2% |
| Trinidadians and Tobagonians | 0.0 /100 | #292 | Tragic 5.2% |
| Immigrants | Senegal | 0.0 /100 | #293 | Tragic 5.2% |
| Belizeans | 0.0 /100 | #294 | Tragic 5.2% |
| Jamaicans | 0.0 /100 | #295 | Tragic 5.3% |
| Aleuts | 0.0 /100 | #296 | Tragic 5.3% |
| West Indians | 0.0 /100 | #297 | Tragic 5.3% |
| Immigrants | Trinidad and Tobago | 0.0 /100 | #298 | Tragic 5.3% |
| Ecuadorians | 0.0 /100 | #299 | Tragic 5.3% |
| Central American Indians | 0.0 /100 | #300 | Tragic 5.3% |