Somali vs Osage Unemployment Among Ages 16 to 19 years
COMPARE
Somali
Osage
Unemployment Among Ages 16 to 19 years
Unemployment Among Ages 16 to 19 years Comparison
Somalis
Osage
15.7%
UNEMPLOYMENT AMONG AGES 16 TO 19 YEARS
100.0/ 100
METRIC RATING
17th/ 347
METRIC RANK
17.6%
UNEMPLOYMENT AMONG AGES 16 TO 19 YEARS
50.0/ 100
METRIC RATING
174th/ 347
METRIC RANK
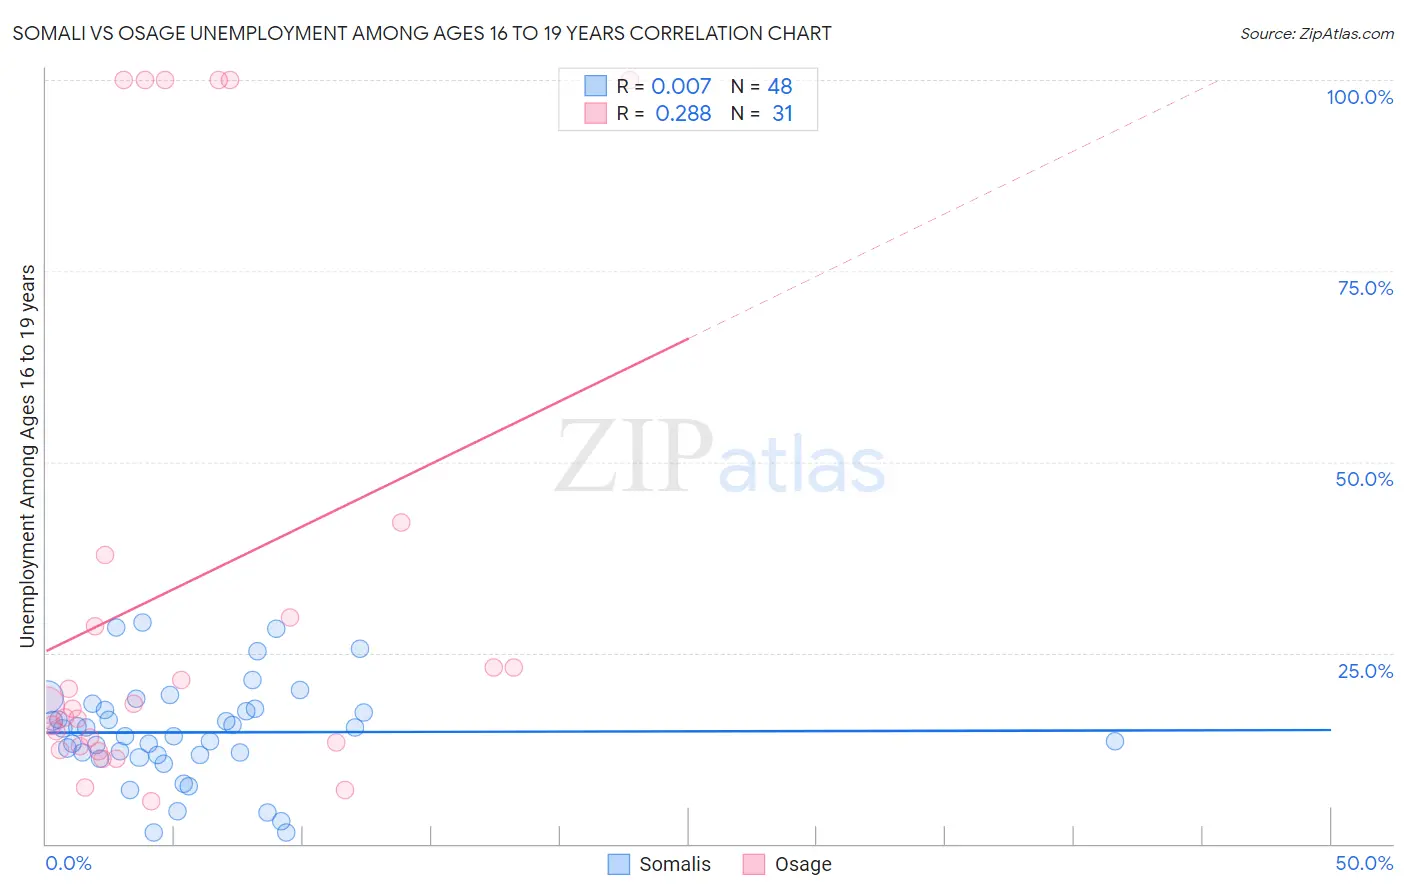
Somali vs Osage Unemployment Among Ages 16 to 19 years Correlation Chart
The statistical analysis conducted on geographies consisting of 98,133,390 people shows no correlation between the proportion of Somalis and unemployment rate among population between the ages 16 and 19 in the United States with a correlation coefficient (R) of 0.007 and weighted average of 15.7%. Similarly, the statistical analysis conducted on geographies consisting of 89,906,286 people shows a weak positive correlation between the proportion of Osage and unemployment rate among population between the ages 16 and 19 in the United States with a correlation coefficient (R) of 0.288 and weighted average of 17.6%, a difference of 11.9%.
Unemployment Among Ages 16 to 19 years Correlation Summary
| Measurement | Somali | Osage |
| Minimum | 1.5% | 5.5% |
| Maximum | 28.9% | 100.0% |
| Range | 27.4% | 94.5% |
| Mean | 14.6% | 33.9% |
| Median | 14.6% | 18.2% |
| Interquartile 25% (IQ1) | 11.6% | 12.7% |
| Interquartile 75% (IQ3) | 17.6% | 37.8% |
| Interquartile Range (IQR) | 5.9% | 25.1% |
| Standard Deviation (Sample) | 6.4% | 33.9% |
| Standard Deviation (Population) | 6.4% | 33.4% |
Similar Demographics by Unemployment Among Ages 16 to 19 years
Demographics Similar to Somalis by Unemployment Among Ages 16 to 19 years
In terms of unemployment among ages 16 to 19 years, the demographic groups most similar to Somalis are German (15.7%, a difference of 0.21%), Thai (15.7%, a difference of 0.24%), Swiss (15.8%, a difference of 0.35%), Sudanese (15.8%, a difference of 0.44%), and Yugoslavian (15.6%, a difference of 0.50%).
| Demographics | Rating | Rank | Unemployment Among Ages 16 to 19 years |
| Zimbabweans | 100.0 /100 | #10 | Exceptional 15.4% |
| Indonesians | 100.0 /100 | #11 | Exceptional 15.5% |
| Taiwanese | 100.0 /100 | #12 | Exceptional 15.5% |
| Immigrants | Burma/Myanmar | 100.0 /100 | #13 | Exceptional 15.6% |
| Immigrants | Zaire | 100.0 /100 | #14 | Exceptional 15.6% |
| Yugoslavians | 100.0 /100 | #15 | Exceptional 15.6% |
| Germans | 100.0 /100 | #16 | Exceptional 15.7% |
| Somalis | 100.0 /100 | #17 | Exceptional 15.7% |
| Thais | 100.0 /100 | #18 | Exceptional 15.7% |
| Swiss | 100.0 /100 | #19 | Exceptional 15.8% |
| Sudanese | 100.0 /100 | #20 | Exceptional 15.8% |
| Immigrants | Taiwan | 100.0 /100 | #21 | Exceptional 15.8% |
| Finns | 100.0 /100 | #22 | Exceptional 15.9% |
| Belgians | 100.0 /100 | #23 | Exceptional 15.9% |
| Tongans | 100.0 /100 | #24 | Exceptional 15.9% |
Demographics Similar to Osage by Unemployment Among Ages 16 to 19 years
In terms of unemployment among ages 16 to 19 years, the demographic groups most similar to Osage are Chilean (17.6%, a difference of 0.040%), Immigrants from Sweden (17.6%, a difference of 0.040%), Nicaraguan (17.6%, a difference of 0.050%), Bermudan (17.6%, a difference of 0.060%), and Celtic (17.6%, a difference of 0.060%).
| Demographics | Rating | Rank | Unemployment Among Ages 16 to 19 years |
| Immigrants | France | 54.9 /100 | #167 | Average 17.5% |
| Immigrants | Hungary | 54.7 /100 | #168 | Average 17.5% |
| Immigrants | Cambodia | 54.5 /100 | #169 | Average 17.5% |
| Immigrants | Romania | 53.3 /100 | #170 | Average 17.5% |
| Immigrants | Switzerland | 53.2 /100 | #171 | Average 17.5% |
| Immigrants | Western Europe | 52.2 /100 | #172 | Average 17.6% |
| Chileans | 50.8 /100 | #173 | Average 17.6% |
| Osage | 50.0 /100 | #174 | Average 17.6% |
| Immigrants | Sweden | 49.1 /100 | #175 | Average 17.6% |
| Nicaraguans | 48.9 /100 | #176 | Average 17.6% |
| Bermudans | 48.7 /100 | #177 | Average 17.6% |
| Celtics | 48.7 /100 | #178 | Average 17.6% |
| Americans | 47.4 /100 | #179 | Average 17.6% |
| Spaniards | 47.1 /100 | #180 | Average 17.6% |
| Immigrants | Turkey | 45.6 /100 | #181 | Average 17.6% |