Immigrants from Eastern Asia vs South American Unemployment Among Ages 60 to 64 years
COMPARE
Immigrants from Eastern Asia
South American
Unemployment Among Ages 60 to 64 years
Unemployment Among Ages 60 to 64 years Comparison
Immigrants from Eastern Asia
South Americans
5.0%
UNEMPLOYMENT AMONG AGES 60 TO 64 YEARS
4.7/ 100
METRIC RATING
232nd/ 347
METRIC RANK
5.1%
UNEMPLOYMENT AMONG AGES 60 TO 64 YEARS
1.0/ 100
METRIC RATING
249th/ 347
METRIC RANK
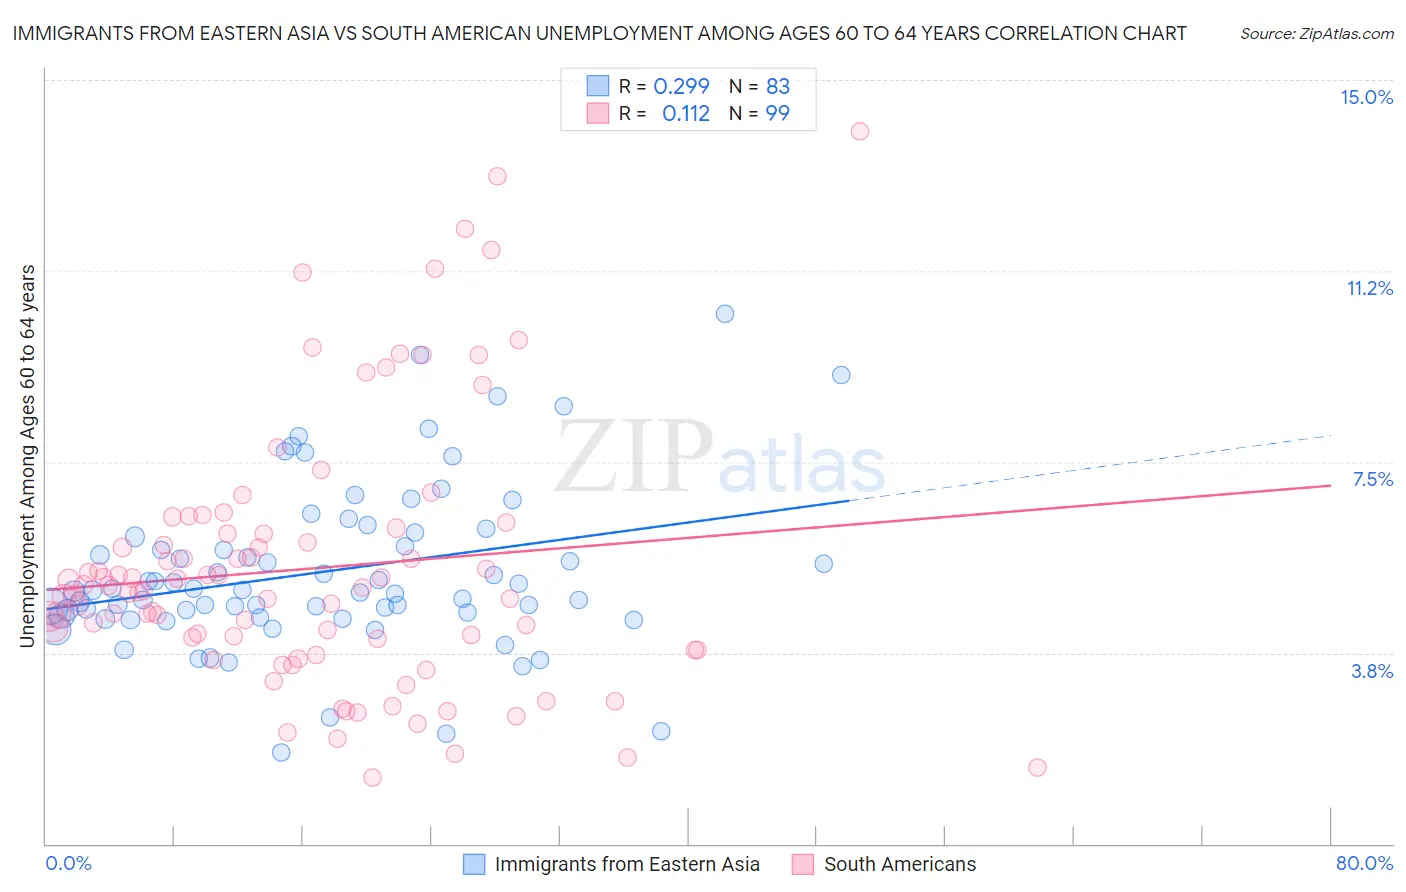
Immigrants from Eastern Asia vs South American Unemployment Among Ages 60 to 64 years Correlation Chart
The statistical analysis conducted on geographies consisting of 434,190,797 people shows a weak positive correlation between the proportion of Immigrants from Eastern Asia and unemployment rate among population between the ages 60 and 64 in the United States with a correlation coefficient (R) of 0.299 and weighted average of 5.0%. Similarly, the statistical analysis conducted on geographies consisting of 432,918,226 people shows a poor positive correlation between the proportion of South Americans and unemployment rate among population between the ages 60 and 64 in the United States with a correlation coefficient (R) of 0.112 and weighted average of 5.1%, a difference of 1.3%.
Unemployment Among Ages 60 to 64 years Correlation Summary
| Measurement | Immigrants from Eastern Asia | South American |
| Minimum | 1.8% | 1.3% |
| Maximum | 10.4% | 14.0% |
| Range | 8.6% | 12.7% |
| Mean | 5.3% | 5.4% |
| Median | 5.0% | 5.0% |
| Interquartile 25% (IQ1) | 4.5% | 3.8% |
| Interquartile 75% (IQ3) | 6.0% | 6.1% |
| Interquartile Range (IQR) | 1.5% | 2.3% |
| Standard Deviation (Sample) | 1.6% | 2.6% |
| Standard Deviation (Population) | 1.6% | 2.6% |
Demographics Similar to Immigrants from Eastern Asia and South Americans by Unemployment Among Ages 60 to 64 years
In terms of unemployment among ages 60 to 64 years, the demographic groups most similar to Immigrants from Eastern Asia are Immigrants from Greece (5.0%, a difference of 0.020%), Iranian (5.0%, a difference of 0.12%), Immigrants from Denmark (5.0%, a difference of 0.18%), Tohono O'odham (5.0%, a difference of 0.18%), and Delaware (5.0%, a difference of 0.25%). Similarly, the demographic groups most similar to South Americans are Immigrants from Fiji (5.1%, a difference of 0.030%), Immigrants from South America (5.0%, a difference of 0.080%), Immigrants from North Macedonia (5.0%, a difference of 0.080%), Immigrants from Cambodia (5.1%, a difference of 0.10%), and Comanche (5.0%, a difference of 0.21%).
| Demographics | Rating | Rank | Unemployment Among Ages 60 to 64 years |
| Immigrants | Denmark | 5.8 /100 | #230 | Tragic 5.0% |
| Tohono O'odham | 5.7 /100 | #231 | Tragic 5.0% |
| Immigrants | Eastern Asia | 4.7 /100 | #232 | Tragic 5.0% |
| Immigrants | Greece | 4.6 /100 | #233 | Tragic 5.0% |
| Iranians | 4.2 /100 | #234 | Tragic 5.0% |
| Delaware | 3.6 /100 | #235 | Tragic 5.0% |
| Immigrants | Sierra Leone | 3.1 /100 | #236 | Tragic 5.0% |
| Immigrants | Western Asia | 3.0 /100 | #237 | Tragic 5.0% |
| Immigrants | Poland | 3.0 /100 | #238 | Tragic 5.0% |
| Ghanaians | 2.4 /100 | #239 | Tragic 5.0% |
| Immigrants | Croatia | 2.2 /100 | #240 | Tragic 5.0% |
| Indians (Asian) | 2.2 /100 | #241 | Tragic 5.0% |
| Argentineans | 2.1 /100 | #242 | Tragic 5.0% |
| Immigrants | Philippines | 1.9 /100 | #243 | Tragic 5.0% |
| Peruvians | 1.6 /100 | #244 | Tragic 5.0% |
| Comanche | 1.3 /100 | #245 | Tragic 5.0% |
| Immigrants | South America | 1.1 /100 | #246 | Tragic 5.0% |
| Immigrants | North Macedonia | 1.1 /100 | #247 | Tragic 5.0% |
| Immigrants | Fiji | 1.1 /100 | #248 | Tragic 5.1% |
| South Americans | 1.0 /100 | #249 | Tragic 5.1% |
| Immigrants | Cambodia | 0.9 /100 | #250 | Tragic 5.1% |