Slovene vs Lebanese Unemployment Among Ages 45 to 54 years
COMPARE
Slovene
Lebanese
Unemployment Among Ages 45 to 54 years
Unemployment Among Ages 45 to 54 years Comparison
Slovenes
Lebanese
4.2%
UNEMPLOYMENT AMONG AGES 45 TO 54 YEARS
99.9/ 100
METRIC RATING
32nd/ 347
METRIC RANK
4.4%
UNEMPLOYMENT AMONG AGES 45 TO 54 YEARS
81.9/ 100
METRIC RATING
137th/ 347
METRIC RANK
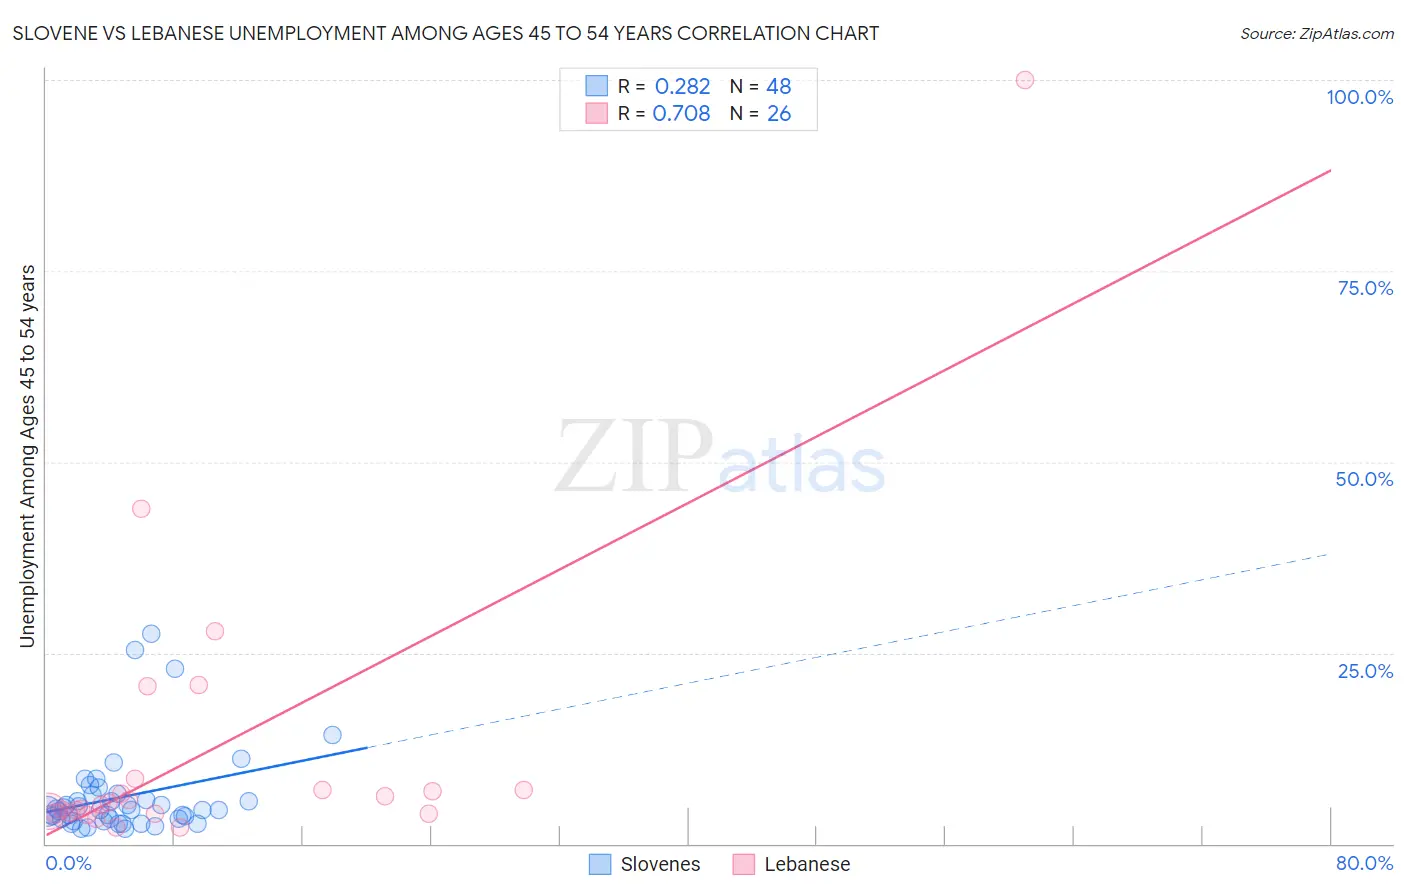
Slovene vs Lebanese Unemployment Among Ages 45 to 54 years Correlation Chart
The statistical analysis conducted on geographies consisting of 255,641,868 people shows a weak positive correlation between the proportion of Slovenes and unemployment rate among population between the ages 45 and 54 in the United States with a correlation coefficient (R) of 0.282 and weighted average of 4.2%. Similarly, the statistical analysis conducted on geographies consisting of 390,458,993 people shows a strong positive correlation between the proportion of Lebanese and unemployment rate among population between the ages 45 and 54 in the United States with a correlation coefficient (R) of 0.708 and weighted average of 4.4%, a difference of 6.9%.
Unemployment Among Ages 45 to 54 years Correlation Summary
| Measurement | Slovene | Lebanese |
| Minimum | 2.0% | 2.2% |
| Maximum | 27.5% | 100.0% |
| Range | 25.5% | 97.8% |
| Mean | 6.1% | 12.2% |
| Median | 4.4% | 5.2% |
| Interquartile 25% (IQ1) | 3.3% | 4.0% |
| Interquartile 75% (IQ3) | 6.0% | 7.0% |
| Interquartile Range (IQR) | 2.8% | 3.0% |
| Standard Deviation (Sample) | 5.6% | 20.3% |
| Standard Deviation (Population) | 5.5% | 19.9% |
Similar Demographics by Unemployment Among Ages 45 to 54 years
Demographics Similar to Slovenes by Unemployment Among Ages 45 to 54 years
In terms of unemployment among ages 45 to 54 years, the demographic groups most similar to Slovenes are Immigrants from South Central Asia (4.2%, a difference of 0.020%), Bhutanese (4.2%, a difference of 0.11%), British (4.1%, a difference of 0.13%), Belgian (4.1%, a difference of 0.14%), and Welsh (4.1%, a difference of 0.28%).
| Demographics | Rating | Rank | Unemployment Among Ages 45 to 54 years |
| Bolivians | 99.9 /100 | #25 | Exceptional 4.1% |
| Scottish | 99.9 /100 | #26 | Exceptional 4.1% |
| Immigrants | Moldova | 99.9 /100 | #27 | Exceptional 4.1% |
| Welsh | 99.9 /100 | #28 | Exceptional 4.1% |
| Belgians | 99.9 /100 | #29 | Exceptional 4.1% |
| British | 99.9 /100 | #30 | Exceptional 4.1% |
| Bhutanese | 99.9 /100 | #31 | Exceptional 4.2% |
| Slovenes | 99.9 /100 | #32 | Exceptional 4.2% |
| Immigrants | South Central Asia | 99.9 /100 | #33 | Exceptional 4.2% |
| Dutch | 99.9 /100 | #34 | Exceptional 4.2% |
| Immigrants | Taiwan | 99.8 /100 | #35 | Exceptional 4.2% |
| Croatians | 99.8 /100 | #36 | Exceptional 4.2% |
| Osage | 99.8 /100 | #37 | Exceptional 4.2% |
| Scotch-Irish | 99.8 /100 | #38 | Exceptional 4.2% |
| Jordanians | 99.8 /100 | #39 | Exceptional 4.2% |
Demographics Similar to Lebanese by Unemployment Among Ages 45 to 54 years
In terms of unemployment among ages 45 to 54 years, the demographic groups most similar to Lebanese are Immigrants from Congo (4.4%, a difference of 0.010%), Immigrants from Kuwait (4.4%, a difference of 0.020%), Immigrants from Zaire (4.4%, a difference of 0.10%), Immigrants from Middle Africa (4.4%, a difference of 0.12%), and Immigrants from Eastern Asia (4.4%, a difference of 0.17%).
| Demographics | Rating | Rank | Unemployment Among Ages 45 to 54 years |
| Celtics | 86.2 /100 | #130 | Excellent 4.4% |
| Immigrants | Germany | 85.9 /100 | #131 | Excellent 4.4% |
| Immigrants | Eastern Africa | 85.1 /100 | #132 | Excellent 4.4% |
| Immigrants | Cameroon | 84.8 /100 | #133 | Excellent 4.4% |
| Afghans | 84.6 /100 | #134 | Excellent 4.4% |
| Immigrants | Eastern Asia | 84.0 /100 | #135 | Excellent 4.4% |
| Immigrants | Middle Africa | 83.3 /100 | #136 | Excellent 4.4% |
| Lebanese | 81.9 /100 | #137 | Excellent 4.4% |
| Immigrants | Congo | 81.8 /100 | #138 | Excellent 4.4% |
| Immigrants | Kuwait | 81.7 /100 | #139 | Excellent 4.4% |
| Immigrants | Zaire | 80.7 /100 | #140 | Excellent 4.4% |
| Immigrants | Afghanistan | 79.6 /100 | #141 | Good 4.4% |
| Immigrants | Netherlands | 79.4 /100 | #142 | Good 4.4% |
| Macedonians | 79.0 /100 | #143 | Good 4.5% |
| Taiwanese | 77.9 /100 | #144 | Good 4.5% |