Slovene vs Immigrants from Bangladesh Seniors Poverty Over the Age of 65
COMPARE
Slovene
Immigrants from Bangladesh
Seniors Poverty Over the Age of 65
Seniors Poverty Over the Age of 65 Comparison
Slovenes
Immigrants from Bangladesh
9.3%
SENIORS POVERTY OVER THE AGE OF 65
99.9/ 100
METRIC RATING
22nd/ 347
METRIC RANK
14.1%
SENIORS POVERTY OVER THE AGE OF 65
0.0/ 100
METRIC RATING
303rd/ 347
METRIC RANK
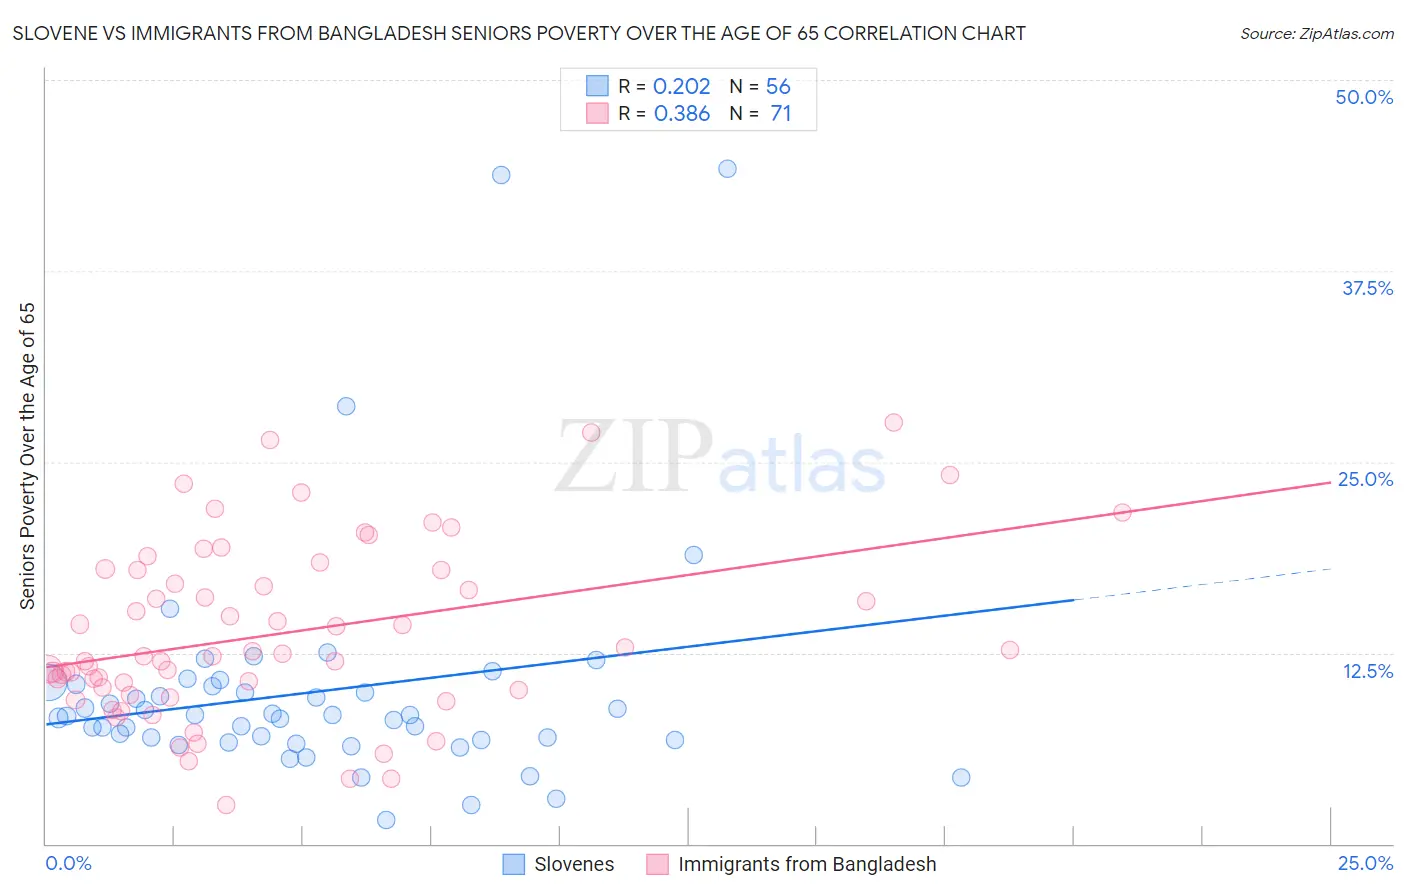
Slovene vs Immigrants from Bangladesh Seniors Poverty Over the Age of 65 Correlation Chart
The statistical analysis conducted on geographies consisting of 260,780,275 people shows a weak positive correlation between the proportion of Slovenes and poverty level among seniors over the age of 65 in the United States with a correlation coefficient (R) of 0.202 and weighted average of 9.3%. Similarly, the statistical analysis conducted on geographies consisting of 203,306,986 people shows a mild positive correlation between the proportion of Immigrants from Bangladesh and poverty level among seniors over the age of 65 in the United States with a correlation coefficient (R) of 0.386 and weighted average of 14.1%, a difference of 52.1%.
Seniors Poverty Over the Age of 65 Correlation Summary
| Measurement | Slovene | Immigrants from Bangladesh |
| Minimum | 1.5% | 2.6% |
| Maximum | 44.2% | 27.6% |
| Range | 42.7% | 25.0% |
| Mean | 10.0% | 13.8% |
| Median | 8.4% | 12.3% |
| Interquartile 25% (IQ1) | 6.8% | 10.1% |
| Interquartile 75% (IQ3) | 10.4% | 17.9% |
| Interquartile Range (IQR) | 3.6% | 7.9% |
| Standard Deviation (Sample) | 7.7% | 5.7% |
| Standard Deviation (Population) | 7.6% | 5.7% |
Similar Demographics by Seniors Poverty Over the Age of 65
Demographics Similar to Slovenes by Seniors Poverty Over the Age of 65
In terms of seniors poverty over the age of 65, the demographic groups most similar to Slovenes are Luxembourger (9.2%, a difference of 0.030%), Welsh (9.3%, a difference of 0.050%), Bulgarian (9.3%, a difference of 0.12%), Thai (9.2%, a difference of 0.32%), and Irish (9.3%, a difference of 0.40%).
| Demographics | Rating | Rank | Seniors Poverty Over the Age of 65 |
| Dutch | 99.9 /100 | #15 | Exceptional 9.1% |
| Europeans | 99.9 /100 | #16 | Exceptional 9.2% |
| Scottish | 99.9 /100 | #17 | Exceptional 9.2% |
| Slovaks | 99.9 /100 | #18 | Exceptional 9.2% |
| Swiss | 99.9 /100 | #19 | Exceptional 9.2% |
| Thais | 99.9 /100 | #20 | Exceptional 9.2% |
| Luxembourgers | 99.9 /100 | #21 | Exceptional 9.2% |
| Slovenes | 99.9 /100 | #22 | Exceptional 9.3% |
| Welsh | 99.9 /100 | #23 | Exceptional 9.3% |
| Bulgarians | 99.9 /100 | #24 | Exceptional 9.3% |
| Irish | 99.9 /100 | #25 | Exceptional 9.3% |
| Immigrants | Scotland | 99.9 /100 | #26 | Exceptional 9.3% |
| Italians | 99.9 /100 | #27 | Exceptional 9.3% |
| Tongans | 99.9 /100 | #28 | Exceptional 9.3% |
| Bhutanese | 99.9 /100 | #29 | Exceptional 9.3% |
Demographics Similar to Immigrants from Bangladesh by Seniors Poverty Over the Age of 65
In terms of seniors poverty over the age of 65, the demographic groups most similar to Immigrants from Bangladesh are Yup'ik (14.1%, a difference of 0.11%), U.S. Virgin Islander (14.0%, a difference of 0.19%), West Indian (14.1%, a difference of 0.24%), Immigrants from Trinidad and Tobago (14.1%, a difference of 0.30%), and Immigrants from Uzbekistan (14.0%, a difference of 0.39%).
| Demographics | Rating | Rank | Seniors Poverty Over the Age of 65 |
| Immigrants | Jamaica | 0.0 /100 | #296 | Tragic 13.9% |
| Vietnamese | 0.0 /100 | #297 | Tragic 14.0% |
| Immigrants | Belize | 0.0 /100 | #298 | Tragic 14.0% |
| Ecuadorians | 0.0 /100 | #299 | Tragic 14.0% |
| Immigrants | Uzbekistan | 0.0 /100 | #300 | Tragic 14.0% |
| U.S. Virgin Islanders | 0.0 /100 | #301 | Tragic 14.0% |
| Yup'ik | 0.0 /100 | #302 | Tragic 14.1% |
| Immigrants | Bangladesh | 0.0 /100 | #303 | Tragic 14.1% |
| West Indians | 0.0 /100 | #304 | Tragic 14.1% |
| Immigrants | Trinidad and Tobago | 0.0 /100 | #305 | Tragic 14.1% |
| Immigrants | Latin America | 0.0 /100 | #306 | Tragic 14.2% |
| Immigrants | West Indies | 0.0 /100 | #307 | Tragic 14.2% |
| Trinidadians and Tobagonians | 0.0 /100 | #308 | Tragic 14.2% |
| Hondurans | 0.0 /100 | #309 | Tragic 14.2% |
| Bahamians | 0.0 /100 | #310 | Tragic 14.2% |