Sioux vs Hawaiian Unemployment Among Ages 16 to 19 years
COMPARE
Sioux
Hawaiian
Unemployment Among Ages 16 to 19 years
Unemployment Among Ages 16 to 19 years Comparison
Sioux
Hawaiians
19.7%
UNEMPLOYMENT AMONG AGES 16 TO 19 YEARS
0.0/ 100
METRIC RATING
283rd/ 347
METRIC RANK
17.9%
UNEMPLOYMENT AMONG AGES 16 TO 19 YEARS
16.8/ 100
METRIC RATING
208th/ 347
METRIC RANK
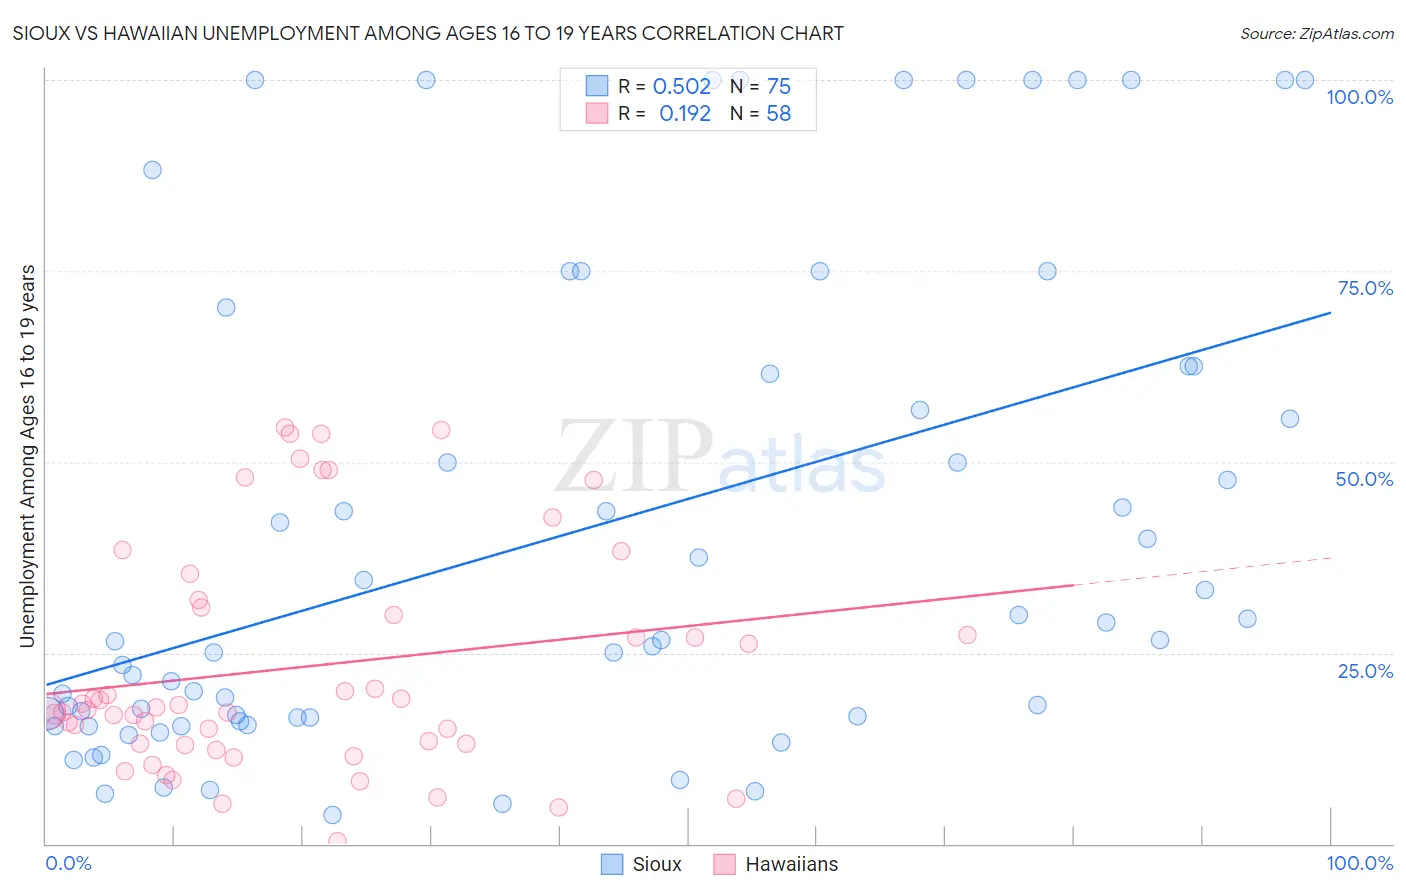
Sioux vs Hawaiian Unemployment Among Ages 16 to 19 years Correlation Chart
The statistical analysis conducted on geographies consisting of 225,477,906 people shows a substantial positive correlation between the proportion of Sioux and unemployment rate among population between the ages 16 and 19 in the United States with a correlation coefficient (R) of 0.502 and weighted average of 19.7%. Similarly, the statistical analysis conducted on geographies consisting of 314,037,858 people shows a poor positive correlation between the proportion of Hawaiians and unemployment rate among population between the ages 16 and 19 in the United States with a correlation coefficient (R) of 0.192 and weighted average of 17.9%, a difference of 10.1%.
Unemployment Among Ages 16 to 19 years Correlation Summary
| Measurement | Sioux | Hawaiian |
| Minimum | 3.7% | 0.40% |
| Maximum | 100.0% | 54.5% |
| Range | 96.3% | 54.1% |
| Mean | 40.6% | 23.1% |
| Median | 26.6% | 17.7% |
| Interquartile 25% (IQ1) | 16.5% | 13.1% |
| Interquartile 75% (IQ3) | 62.5% | 31.0% |
| Interquartile Range (IQR) | 46.0% | 17.9% |
| Standard Deviation (Sample) | 31.6% | 14.9% |
| Standard Deviation (Population) | 31.4% | 14.7% |
Similar Demographics by Unemployment Among Ages 16 to 19 years
Demographics Similar to Sioux by Unemployment Among Ages 16 to 19 years
In terms of unemployment among ages 16 to 19 years, the demographic groups most similar to Sioux are Sierra Leonean (19.7%, a difference of 0.010%), Dutch West Indian (19.7%, a difference of 0.050%), Ghanaian (19.8%, a difference of 0.19%), Bahamian (19.8%, a difference of 0.31%), and Immigrants from Ghana (19.8%, a difference of 0.38%).
| Demographics | Rating | Rank | Unemployment Among Ages 16 to 19 years |
| Immigrants | Latin America | 0.0 /100 | #276 | Tragic 19.4% |
| Immigrants | Western Africa | 0.0 /100 | #277 | Tragic 19.4% |
| Africans | 0.0 /100 | #278 | Tragic 19.5% |
| Ute | 0.0 /100 | #279 | Tragic 19.6% |
| Cajuns | 0.0 /100 | #280 | Tragic 19.6% |
| Cypriots | 0.0 /100 | #281 | Tragic 19.6% |
| Dutch West Indians | 0.0 /100 | #282 | Tragic 19.7% |
| Sioux | 0.0 /100 | #283 | Tragic 19.7% |
| Sierra Leoneans | 0.0 /100 | #284 | Tragic 19.7% |
| Ghanaians | 0.0 /100 | #285 | Tragic 19.8% |
| Bahamians | 0.0 /100 | #286 | Tragic 19.8% |
| Immigrants | Ghana | 0.0 /100 | #287 | Tragic 19.8% |
| Immigrants | Azores | 0.0 /100 | #288 | Tragic 19.8% |
| Pueblo | 0.0 /100 | #289 | Tragic 19.8% |
| Immigrants | Sierra Leone | 0.0 /100 | #290 | Tragic 20.0% |
Demographics Similar to Hawaiians by Unemployment Among Ages 16 to 19 years
In terms of unemployment among ages 16 to 19 years, the demographic groups most similar to Hawaiians are Cherokee (17.9%, a difference of 0.090%), Carpatho Rusyn (17.9%, a difference of 0.10%), Liberian (17.9%, a difference of 0.15%), Immigrants from Southern Europe (17.9%, a difference of 0.17%), and Guamanian/Chamorro (17.9%, a difference of 0.20%).
| Demographics | Rating | Rank | Unemployment Among Ages 16 to 19 years |
| Immigrants | Ethiopia | 27.4 /100 | #201 | Fair 17.8% |
| Immigrants | Portugal | 27.2 /100 | #202 | Fair 17.8% |
| Immigrants | Eastern Europe | 23.6 /100 | #203 | Fair 17.8% |
| Immigrants | Nonimmigrants | 20.9 /100 | #204 | Fair 17.9% |
| Assyrians/Chaldeans/Syriacs | 20.8 /100 | #205 | Fair 17.9% |
| Immigrants | Southern Europe | 18.9 /100 | #206 | Poor 17.9% |
| Liberians | 18.6 /100 | #207 | Poor 17.9% |
| Hawaiians | 16.8 /100 | #208 | Poor 17.9% |
| Cherokee | 15.7 /100 | #209 | Poor 17.9% |
| Carpatho Rusyns | 15.6 /100 | #210 | Poor 17.9% |
| Guamanians/Chamorros | 14.5 /100 | #211 | Poor 17.9% |
| Argentineans | 13.8 /100 | #212 | Poor 18.0% |
| Chippewa | 13.7 /100 | #213 | Poor 18.0% |
| Immigrants | Morocco | 13.5 /100 | #214 | Poor 18.0% |
| Immigrants | Syria | 13.3 /100 | #215 | Poor 18.0% |