Sierra Leonean vs Potawatomi Unemployment Among Ages 45 to 54 years
COMPARE
Sierra Leonean
Potawatomi
Unemployment Among Ages 45 to 54 years
Unemployment Among Ages 45 to 54 years Comparison
Sierra Leoneans
Potawatomi
4.5%
UNEMPLOYMENT AMONG AGES 45 TO 54 YEARS
46.7/ 100
METRIC RATING
183rd/ 347
METRIC RANK
4.7%
UNEMPLOYMENT AMONG AGES 45 TO 54 YEARS
5.7/ 100
METRIC RATING
223rd/ 347
METRIC RANK
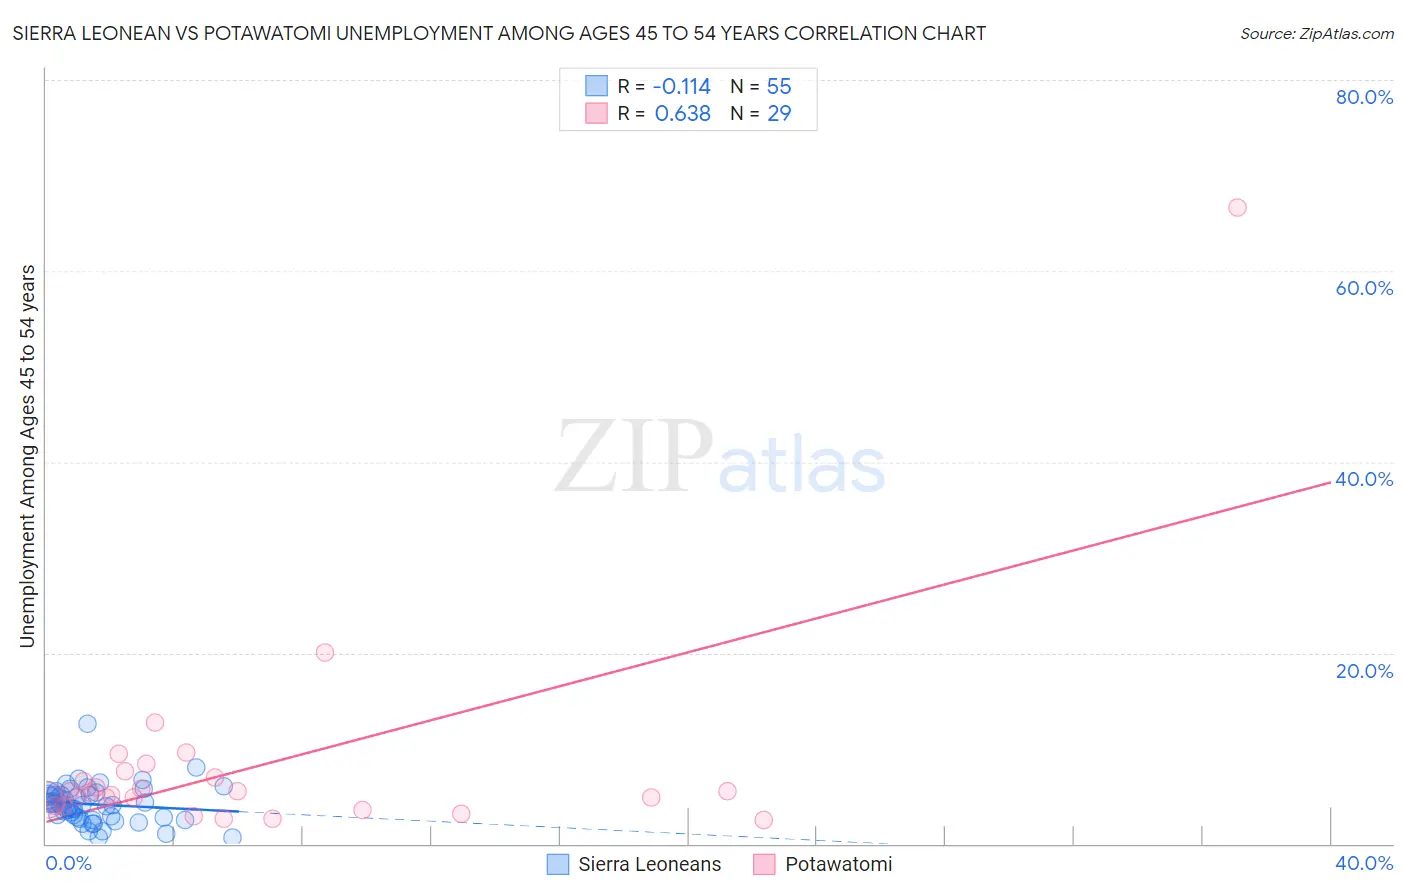
Sierra Leonean vs Potawatomi Unemployment Among Ages 45 to 54 years Correlation Chart
The statistical analysis conducted on geographies consisting of 82,825,579 people shows a poor negative correlation between the proportion of Sierra Leoneans and unemployment rate among population between the ages 45 and 54 in the United States with a correlation coefficient (R) of -0.114 and weighted average of 4.5%. Similarly, the statistical analysis conducted on geographies consisting of 116,004,554 people shows a significant positive correlation between the proportion of Potawatomi and unemployment rate among population between the ages 45 and 54 in the United States with a correlation coefficient (R) of 0.638 and weighted average of 4.7%, a difference of 3.1%.
Unemployment Among Ages 45 to 54 years Correlation Summary
| Measurement | Sierra Leonean | Potawatomi |
| Minimum | 0.60% | 2.5% |
| Maximum | 12.6% | 66.7% |
| Range | 12.0% | 64.2% |
| Mean | 4.1% | 8.1% |
| Median | 4.1% | 5.4% |
| Interquartile 25% (IQ1) | 2.7% | 4.0% |
| Interquartile 75% (IQ3) | 5.1% | 7.3% |
| Interquartile Range (IQR) | 2.4% | 3.3% |
| Standard Deviation (Sample) | 2.0% | 11.8% |
| Standard Deviation (Population) | 2.0% | 11.6% |
Similar Demographics by Unemployment Among Ages 45 to 54 years
Demographics Similar to Sierra Leoneans by Unemployment Among Ages 45 to 54 years
In terms of unemployment among ages 45 to 54 years, the demographic groups most similar to Sierra Leoneans are Immigrants from China (4.5%, a difference of 0.0%), Immigrants from Poland (4.5%, a difference of 0.010%), Malaysian (4.5%, a difference of 0.040%), Immigrants from Hong Kong (4.5%, a difference of 0.040%), and Immigrants from Russia (4.5%, a difference of 0.070%).
| Demographics | Rating | Rank | Unemployment Among Ages 45 to 54 years |
| Puget Sound Salish | 49.1 /100 | #176 | Average 4.5% |
| Immigrants | Northern Africa | 49.0 /100 | #177 | Average 4.5% |
| Immigrants | Australia | 48.5 /100 | #178 | Average 4.5% |
| Immigrants | Russia | 48.2 /100 | #179 | Average 4.5% |
| Malaysians | 47.5 /100 | #180 | Average 4.5% |
| Immigrants | Poland | 47.0 /100 | #181 | Average 4.5% |
| Immigrants | China | 46.7 /100 | #182 | Average 4.5% |
| Sierra Leoneans | 46.7 /100 | #183 | Average 4.5% |
| Immigrants | Hong Kong | 45.9 /100 | #184 | Average 4.5% |
| Immigrants | Philippines | 41.0 /100 | #185 | Average 4.5% |
| Hawaiians | 39.1 /100 | #186 | Fair 4.5% |
| Immigrants | Ukraine | 36.8 /100 | #187 | Fair 4.5% |
| Immigrants | Sierra Leone | 36.3 /100 | #188 | Fair 4.6% |
| Immigrants | Laos | 35.7 /100 | #189 | Fair 4.6% |
| Immigrants | Serbia | 34.8 /100 | #190 | Fair 4.6% |
Demographics Similar to Potawatomi by Unemployment Among Ages 45 to 54 years
In terms of unemployment among ages 45 to 54 years, the demographic groups most similar to Potawatomi are Immigrants from Southern Europe (4.7%, a difference of 0.060%), Choctaw (4.7%, a difference of 0.090%), Comanche (4.7%, a difference of 0.20%), Immigrants from Norway (4.7%, a difference of 0.20%), and Guamanian/Chamorro (4.7%, a difference of 0.22%).
| Demographics | Rating | Rank | Unemployment Among Ages 45 to 54 years |
| Lumbee | 9.2 /100 | #216 | Tragic 4.6% |
| Immigrants | Cambodia | 7.4 /100 | #217 | Tragic 4.7% |
| Immigrants | Uganda | 7.1 /100 | #218 | Tragic 4.7% |
| Nigerians | 7.0 /100 | #219 | Tragic 4.7% |
| Guamanians/Chamorros | 6.8 /100 | #220 | Tragic 4.7% |
| Choctaw | 6.1 /100 | #221 | Tragic 4.7% |
| Immigrants | Southern Europe | 6.0 /100 | #222 | Tragic 4.7% |
| Potawatomi | 5.7 /100 | #223 | Tragic 4.7% |
| Comanche | 4.8 /100 | #224 | Tragic 4.7% |
| Immigrants | Norway | 4.8 /100 | #225 | Tragic 4.7% |
| Assyrians/Chaldeans/Syriacs | 3.5 /100 | #226 | Tragic 4.7% |
| Iraqis | 3.2 /100 | #227 | Tragic 4.7% |
| South American Indians | 3.1 /100 | #228 | Tragic 4.7% |
| Immigrants | Israel | 3.0 /100 | #229 | Tragic 4.7% |
| Japanese | 2.8 /100 | #230 | Tragic 4.7% |