Senegalese vs Immigrants from Sri Lanka Unemployment
COMPARE
Senegalese
Immigrants from Sri Lanka
Unemployment
Unemployment Comparison
Senegalese
Immigrants from Sri Lanka
6.2%
UNEMPLOYMENT
0.0/ 100
METRIC RATING
290th/ 347
METRIC RANK
5.1%
UNEMPLOYMENT
91.1/ 100
METRIC RATING
116th/ 347
METRIC RANK
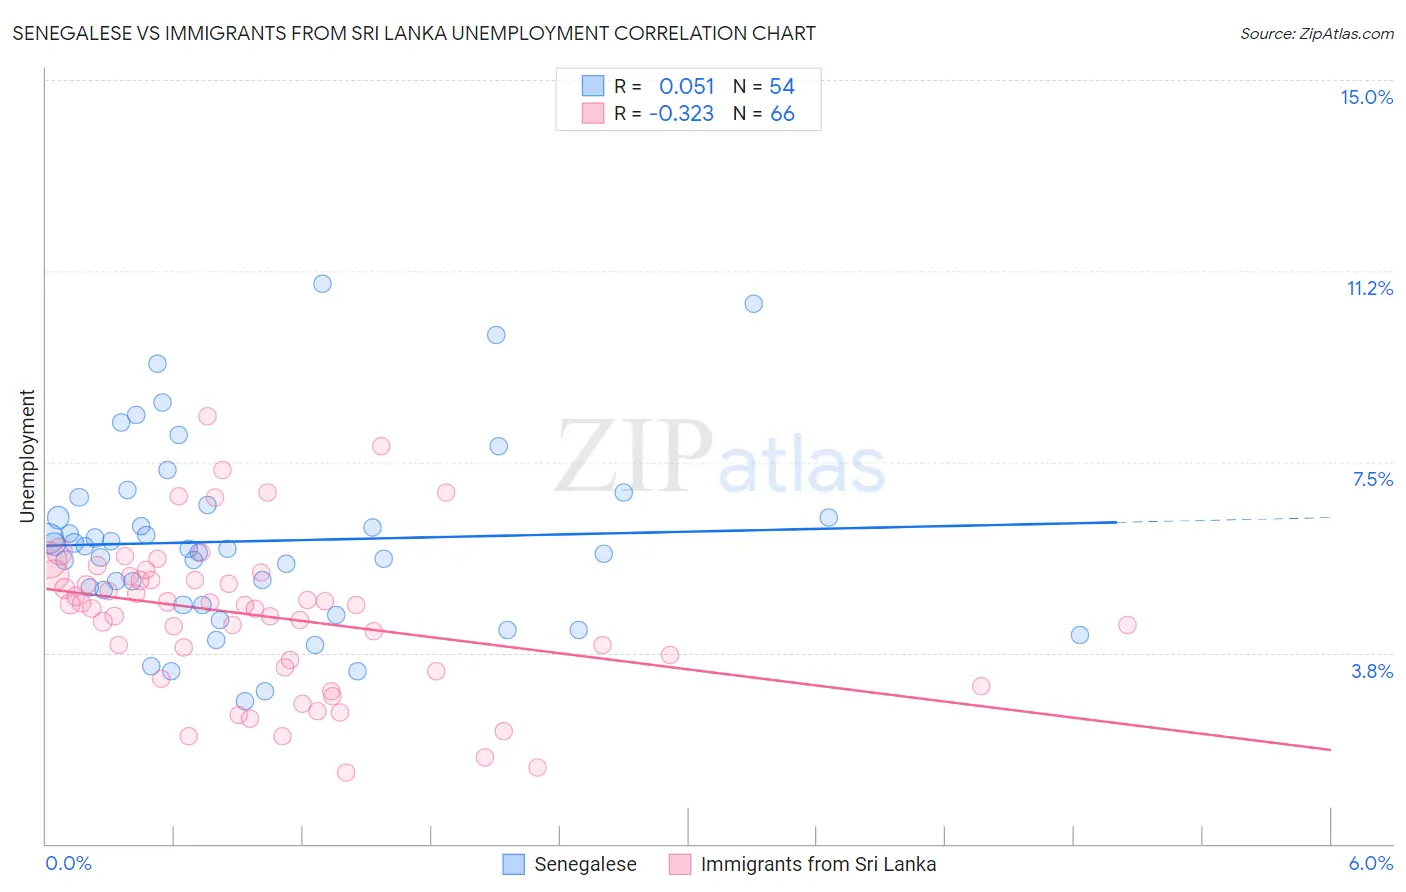
Senegalese vs Immigrants from Sri Lanka Unemployment Correlation Chart
The statistical analysis conducted on geographies consisting of 78,136,746 people shows a slight positive correlation between the proportion of Senegalese and unemployment in the United States with a correlation coefficient (R) of 0.051 and weighted average of 6.2%. Similarly, the statistical analysis conducted on geographies consisting of 149,679,955 people shows a mild negative correlation between the proportion of Immigrants from Sri Lanka and unemployment in the United States with a correlation coefficient (R) of -0.323 and weighted average of 5.1%, a difference of 22.4%.
Unemployment Correlation Summary
| Measurement | Senegalese | Immigrants from Sri Lanka |
| Minimum | 2.8% | 1.4% |
| Maximum | 11.0% | 8.4% |
| Range | 8.2% | 7.0% |
| Mean | 5.9% | 4.5% |
| Median | 5.8% | 4.7% |
| Interquartile 25% (IQ1) | 4.7% | 3.5% |
| Interquartile 75% (IQ3) | 6.7% | 5.2% |
| Interquartile Range (IQR) | 2.0% | 1.8% |
| Standard Deviation (Sample) | 1.8% | 1.5% |
| Standard Deviation (Population) | 1.8% | 1.5% |
Similar Demographics by Unemployment
Demographics Similar to Senegalese by Unemployment
In terms of unemployment, the demographic groups most similar to Senegalese are Chippewa (6.2%, a difference of 0.090%), Ecuadorian (6.2%, a difference of 0.44%), Nepalese (6.2%, a difference of 0.47%), Haitian (6.2%, a difference of 0.53%), and Central American Indian (6.2%, a difference of 0.54%).
| Demographics | Rating | Rank | Unemployment |
| Immigrants | Ghana | 0.0 /100 | #283 | Tragic 6.1% |
| Aleuts | 0.0 /100 | #284 | Tragic 6.1% |
| Immigrants | Senegal | 0.0 /100 | #285 | Tragic 6.1% |
| Immigrants | Caribbean | 0.0 /100 | #286 | Tragic 6.2% |
| Nepalese | 0.0 /100 | #287 | Tragic 6.2% |
| Ecuadorians | 0.0 /100 | #288 | Tragic 6.2% |
| Chippewa | 0.0 /100 | #289 | Tragic 6.2% |
| Senegalese | 0.0 /100 | #290 | Tragic 6.2% |
| Haitians | 0.0 /100 | #291 | Tragic 6.2% |
| Central American Indians | 0.0 /100 | #292 | Tragic 6.2% |
| Immigrants | Ecuador | 0.0 /100 | #293 | Tragic 6.2% |
| Spanish American Indians | 0.0 /100 | #294 | Tragic 6.2% |
| U.S. Virgin Islanders | 0.0 /100 | #295 | Tragic 6.3% |
| Ute | 0.0 /100 | #296 | Tragic 6.3% |
| Jamaicans | 0.0 /100 | #297 | Tragic 6.3% |
Demographics Similar to Immigrants from Sri Lanka by Unemployment
In terms of unemployment, the demographic groups most similar to Immigrants from Sri Lanka are Immigrants from Western Europe (5.1%, a difference of 0.010%), Immigrants from Malaysia (5.1%, a difference of 0.020%), Immigrants from Germany (5.1%, a difference of 0.050%), Immigrants from Ireland (5.1%, a difference of 0.22%), and Immigrants from France (5.1%, a difference of 0.26%).
| Demographics | Rating | Rank | Unemployment |
| Immigrants | Eritrea | 93.3 /100 | #109 | Exceptional 5.0% |
| Immigrants | Lithuania | 93.2 /100 | #110 | Exceptional 5.0% |
| Chileans | 93.2 /100 | #111 | Exceptional 5.0% |
| South Africans | 92.6 /100 | #112 | Exceptional 5.1% |
| Argentineans | 92.4 /100 | #113 | Exceptional 5.1% |
| Immigrants | Ireland | 92.1 /100 | #114 | Exceptional 5.1% |
| Immigrants | Western Europe | 91.1 /100 | #115 | Exceptional 5.1% |
| Immigrants | Sri Lanka | 91.1 /100 | #116 | Exceptional 5.1% |
| Immigrants | Malaysia | 91.0 /100 | #117 | Exceptional 5.1% |
| Immigrants | Germany | 90.8 /100 | #118 | Exceptional 5.1% |
| Immigrants | France | 89.7 /100 | #119 | Excellent 5.1% |
| Macedonians | 89.7 /100 | #120 | Excellent 5.1% |
| Lebanese | 89.2 /100 | #121 | Excellent 5.1% |
| Immigrants | Switzerland | 89.1 /100 | #122 | Excellent 5.1% |
| Asians | 89.0 /100 | #123 | Excellent 5.1% |