Senegalese vs Australian Unemployment
COMPARE
Senegalese
Australian
Unemployment
Unemployment Comparison
Senegalese
Australians
6.2%
UNEMPLOYMENT
0.0/ 100
METRIC RATING
290th/ 347
METRIC RANK
4.9%
UNEMPLOYMENT
99.2/ 100
METRIC RATING
55th/ 347
METRIC RANK
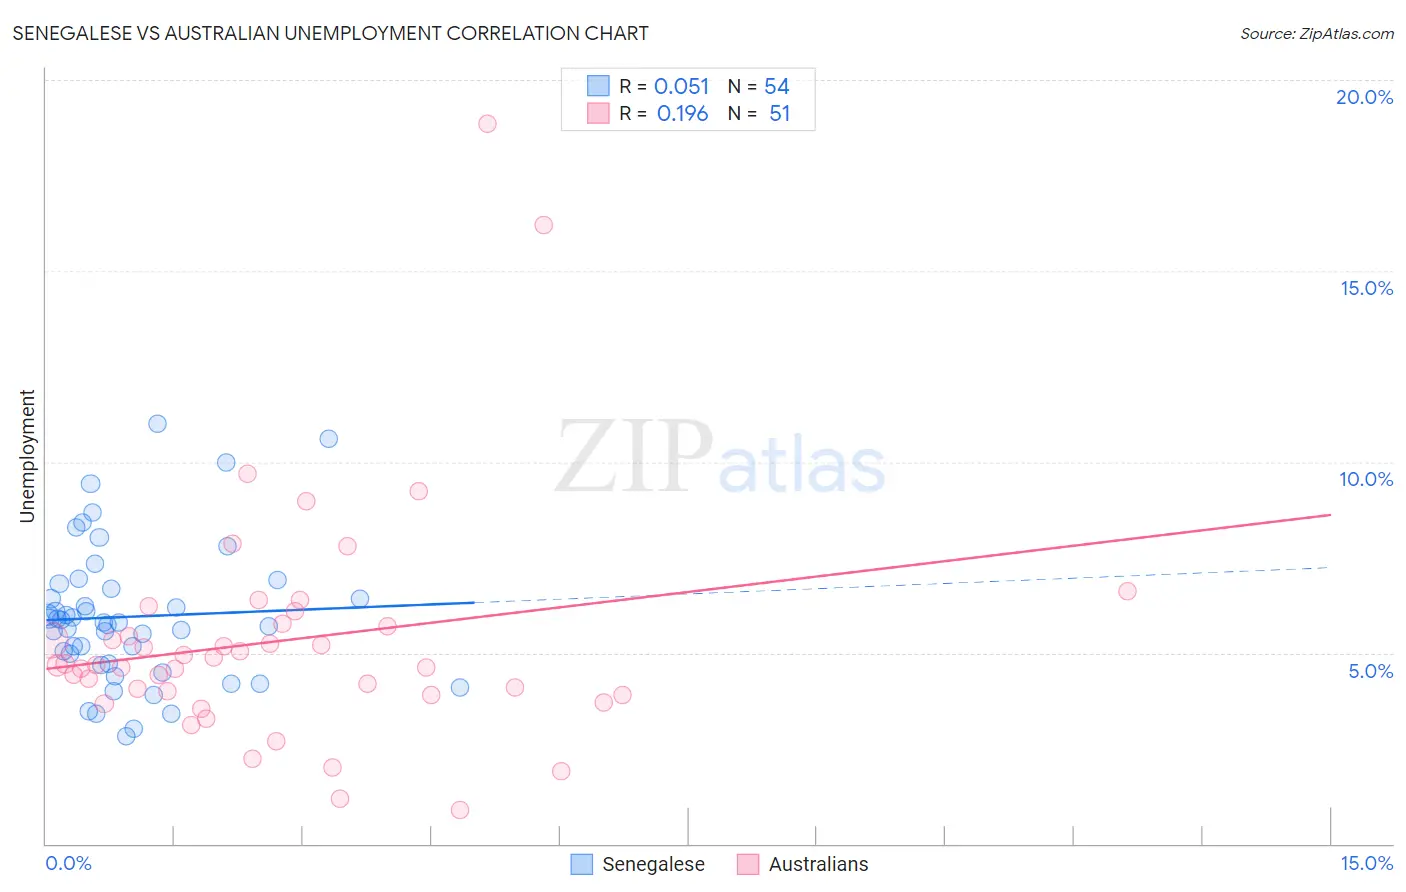
Senegalese vs Australian Unemployment Correlation Chart
The statistical analysis conducted on geographies consisting of 78,136,746 people shows a slight positive correlation between the proportion of Senegalese and unemployment in the United States with a correlation coefficient (R) of 0.051 and weighted average of 6.2%. Similarly, the statistical analysis conducted on geographies consisting of 224,052,970 people shows a poor positive correlation between the proportion of Australians and unemployment in the United States with a correlation coefficient (R) of 0.196 and weighted average of 4.9%, a difference of 27.4%.
Unemployment Correlation Summary
| Measurement | Senegalese | Australian |
| Minimum | 2.8% | 0.90% |
| Maximum | 11.0% | 18.9% |
| Range | 8.2% | 18.0% |
| Mean | 5.9% | 5.3% |
| Median | 5.8% | 4.7% |
| Interquartile 25% (IQ1) | 4.7% | 3.9% |
| Interquartile 75% (IQ3) | 6.7% | 5.8% |
| Interquartile Range (IQR) | 2.0% | 1.9% |
| Standard Deviation (Sample) | 1.8% | 3.1% |
| Standard Deviation (Population) | 1.8% | 3.1% |
Similar Demographics by Unemployment
Demographics Similar to Senegalese by Unemployment
In terms of unemployment, the demographic groups most similar to Senegalese are Chippewa (6.2%, a difference of 0.090%), Ecuadorian (6.2%, a difference of 0.44%), Nepalese (6.2%, a difference of 0.47%), Haitian (6.2%, a difference of 0.53%), and Central American Indian (6.2%, a difference of 0.54%).
| Demographics | Rating | Rank | Unemployment |
| Immigrants | Ghana | 0.0 /100 | #283 | Tragic 6.1% |
| Aleuts | 0.0 /100 | #284 | Tragic 6.1% |
| Immigrants | Senegal | 0.0 /100 | #285 | Tragic 6.1% |
| Immigrants | Caribbean | 0.0 /100 | #286 | Tragic 6.2% |
| Nepalese | 0.0 /100 | #287 | Tragic 6.2% |
| Ecuadorians | 0.0 /100 | #288 | Tragic 6.2% |
| Chippewa | 0.0 /100 | #289 | Tragic 6.2% |
| Senegalese | 0.0 /100 | #290 | Tragic 6.2% |
| Haitians | 0.0 /100 | #291 | Tragic 6.2% |
| Central American Indians | 0.0 /100 | #292 | Tragic 6.2% |
| Immigrants | Ecuador | 0.0 /100 | #293 | Tragic 6.2% |
| Spanish American Indians | 0.0 /100 | #294 | Tragic 6.2% |
| U.S. Virgin Islanders | 0.0 /100 | #295 | Tragic 6.3% |
| Ute | 0.0 /100 | #296 | Tragic 6.3% |
| Jamaicans | 0.0 /100 | #297 | Tragic 6.3% |
Demographics Similar to Australians by Unemployment
In terms of unemployment, the demographic groups most similar to Australians are Eastern European (4.9%, a difference of 0.030%), Immigrants from Zimbabwe (4.9%, a difference of 0.060%), White/Caucasian (4.9%, a difference of 0.090%), Immigrants from Belgium (4.9%, a difference of 0.10%), and Celtic (4.9%, a difference of 0.16%).
| Demographics | Rating | Rank | Unemployment |
| Immigrants | Scotland | 99.3 /100 | #48 | Exceptional 4.9% |
| Immigrants | South Central Asia | 99.3 /100 | #49 | Exceptional 4.9% |
| French Canadians | 99.3 /100 | #50 | Exceptional 4.9% |
| Immigrants | Belgium | 99.2 /100 | #51 | Exceptional 4.9% |
| Whites/Caucasians | 99.2 /100 | #52 | Exceptional 4.9% |
| Immigrants | Zimbabwe | 99.2 /100 | #53 | Exceptional 4.9% |
| Eastern Europeans | 99.2 /100 | #54 | Exceptional 4.9% |
| Australians | 99.2 /100 | #55 | Exceptional 4.9% |
| Celtics | 99.1 /100 | #56 | Exceptional 4.9% |
| Immigrants | Singapore | 99.1 /100 | #57 | Exceptional 4.9% |
| Greeks | 99.0 /100 | #58 | Exceptional 4.9% |
| Bhutanese | 99.0 /100 | #59 | Exceptional 4.9% |
| Immigrants | Netherlands | 99.0 /100 | #60 | Exceptional 4.9% |
| Cambodians | 99.0 /100 | #61 | Exceptional 4.9% |
| Icelanders | 98.9 /100 | #62 | Exceptional 4.9% |