Seminole vs Immigrants from Dominican Republic Unemployment Among Seniors over 65 years
COMPARE
Seminole
Immigrants from Dominican Republic
Unemployment Among Seniors over 65 years
Unemployment Among Seniors over 65 years Comparison
Seminole
Immigrants from Dominican Republic
5.0%
UNEMPLOYMENT AMONG SENIORS OVER 65 YEARS
91.4/ 100
METRIC RATING
113th/ 347
METRIC RANK
6.0%
UNEMPLOYMENT AMONG SENIORS OVER 65 YEARS
0.0/ 100
METRIC RATING
333rd/ 347
METRIC RANK
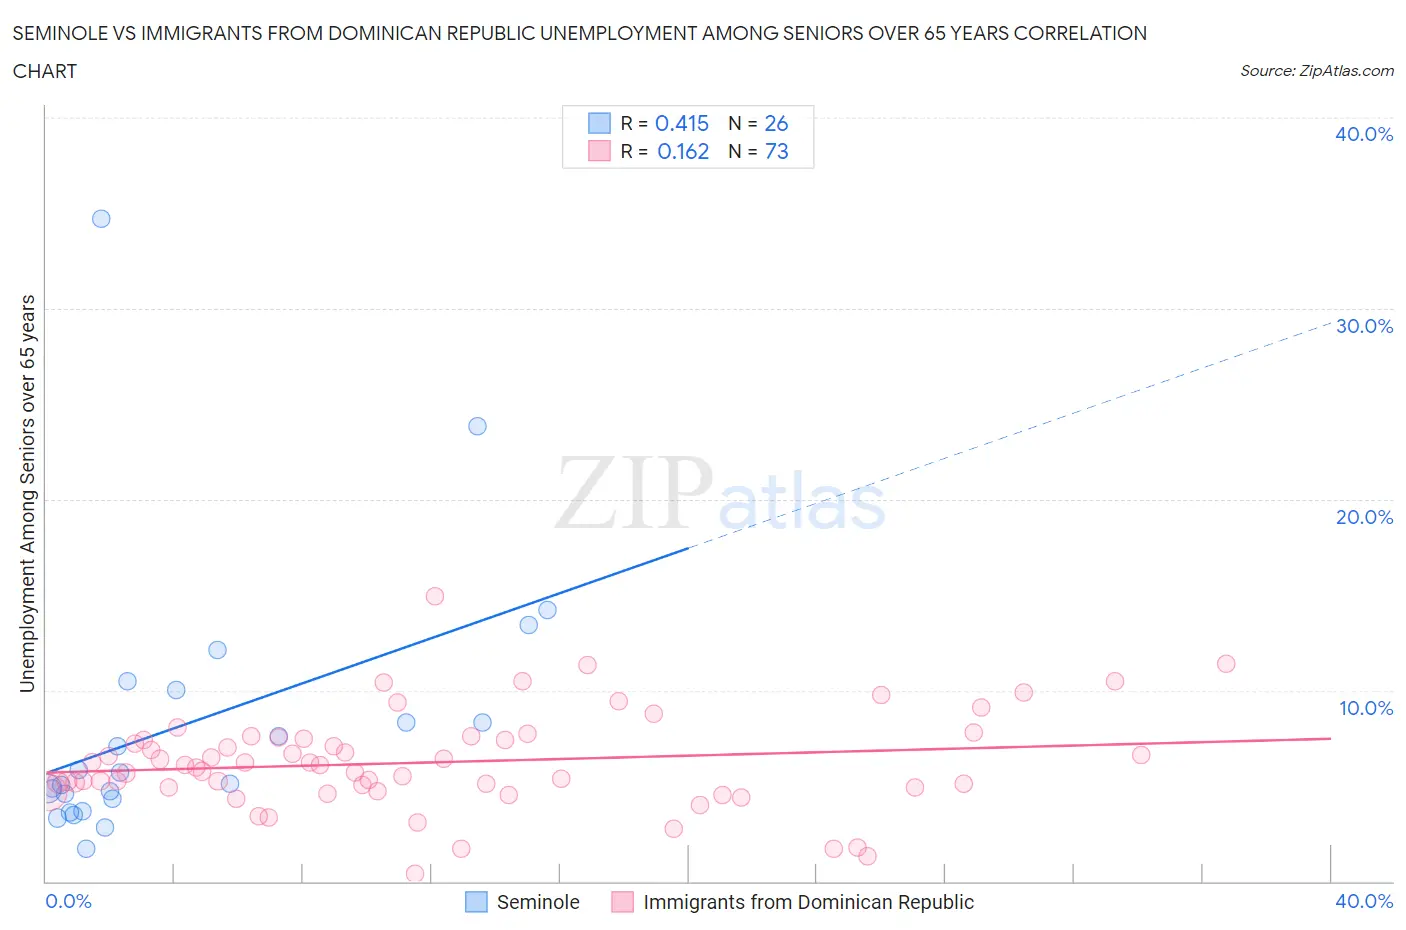
Seminole vs Immigrants from Dominican Republic Unemployment Among Seniors over 65 years Correlation Chart
The statistical analysis conducted on geographies consisting of 112,443,018 people shows a moderate positive correlation between the proportion of Seminole and unemployment rate amomg seniors over the age of 65 in the United States with a correlation coefficient (R) of 0.415 and weighted average of 5.0%. Similarly, the statistical analysis conducted on geographies consisting of 254,579,776 people shows a poor positive correlation between the proportion of Immigrants from Dominican Republic and unemployment rate amomg seniors over the age of 65 in the United States with a correlation coefficient (R) of 0.162 and weighted average of 6.0%, a difference of 19.0%.
Unemployment Among Seniors over 65 years Correlation Summary
| Measurement | Seminole | Immigrants from Dominican Republic |
| Minimum | 1.7% | 0.40% |
| Maximum | 34.7% | 14.9% |
| Range | 33.0% | 14.5% |
| Mean | 8.2% | 6.2% |
| Median | 5.4% | 6.1% |
| Interquartile 25% (IQ1) | 4.3% | 4.9% |
| Interquartile 75% (IQ3) | 10.0% | 7.5% |
| Interquartile Range (IQR) | 5.7% | 2.6% |
| Standard Deviation (Sample) | 7.2% | 2.5% |
| Standard Deviation (Population) | 7.0% | 2.5% |
Similar Demographics by Unemployment Among Seniors over 65 years
Demographics Similar to Seminole by Unemployment Among Seniors over 65 years
In terms of unemployment among seniors over 65 years, the demographic groups most similar to Seminole are Immigrants from Latvia (5.0%, a difference of 0.0%), Celtic (5.0%, a difference of 0.010%), Immigrants from Korea (5.0%, a difference of 0.040%), Eastern European (5.0%, a difference of 0.060%), and Finnish (5.0%, a difference of 0.080%).
| Demographics | Rating | Rank | Unemployment Among Seniors over 65 years |
| Immigrants | Turkey | 94.3 /100 | #106 | Exceptional 5.0% |
| Immigrants | Germany | 93.2 /100 | #107 | Exceptional 5.0% |
| Immigrants | Vietnam | 92.9 /100 | #108 | Exceptional 5.0% |
| Immigrants | Malaysia | 92.7 /100 | #109 | Exceptional 5.0% |
| Immigrants | Saudi Arabia | 92.7 /100 | #110 | Exceptional 5.0% |
| Finns | 92.2 /100 | #111 | Exceptional 5.0% |
| Eastern Europeans | 92.0 /100 | #112 | Exceptional 5.0% |
| Seminole | 91.4 /100 | #113 | Exceptional 5.0% |
| Immigrants | Latvia | 91.4 /100 | #114 | Exceptional 5.0% |
| Celtics | 91.3 /100 | #115 | Exceptional 5.0% |
| Immigrants | Korea | 91.0 /100 | #116 | Exceptional 5.0% |
| Malaysians | 90.4 /100 | #117 | Exceptional 5.1% |
| Soviet Union | 90.1 /100 | #118 | Exceptional 5.1% |
| Immigrants | Canada | 89.7 /100 | #119 | Excellent 5.1% |
| Irish | 88.8 /100 | #120 | Excellent 5.1% |
Demographics Similar to Immigrants from Dominican Republic by Unemployment Among Seniors over 65 years
In terms of unemployment among seniors over 65 years, the demographic groups most similar to Immigrants from Dominican Republic are Aleut (6.0%, a difference of 0.55%), Taiwanese (6.0%, a difference of 0.60%), Immigrants from Portugal (6.0%, a difference of 0.75%), Dominican (6.0%, a difference of 0.77%), and Puerto Rican (5.9%, a difference of 1.5%).
| Demographics | Rating | Rank | Unemployment Among Seniors over 65 years |
| Shoshone | 0.0 /100 | #326 | Tragic 5.9% |
| Bermudans | 0.0 /100 | #327 | Tragic 5.9% |
| Puerto Ricans | 0.0 /100 | #328 | Tragic 5.9% |
| Dominicans | 0.0 /100 | #329 | Tragic 6.0% |
| Immigrants | Portugal | 0.0 /100 | #330 | Tragic 6.0% |
| Taiwanese | 0.0 /100 | #331 | Tragic 6.0% |
| Aleuts | 0.0 /100 | #332 | Tragic 6.0% |
| Immigrants | Dominican Republic | 0.0 /100 | #333 | Tragic 6.0% |
| Tohono O'odham | 0.0 /100 | #334 | Tragic 6.1% |
| Immigrants | Armenia | 0.0 /100 | #335 | Tragic 6.2% |
| Pima | 0.0 /100 | #336 | Tragic 6.3% |
| Alaska Natives | 0.0 /100 | #337 | Tragic 6.3% |
| Immigrants | Azores | 0.0 /100 | #338 | Tragic 6.3% |
| Paiute | 0.0 /100 | #339 | Tragic 6.3% |
| Ute | 0.0 /100 | #340 | Tragic 6.3% |