Seminole vs Cypriot Unemployment Among Seniors over 65 years

COMPARE

Seminole
Race
Ancestry
AfghanAfricanAlaska NativeAlaskan AthabascanAlbanianAleutAlsatianAmericanApacheArabArapahoArgentineanArmenianAssyrian/Chaldean/SyriacAustralianAustrianBahamianBangladeshiBarbadianBasqueBelgianBelizeanBermudanBhutaneseBlackfeetBolivianBrazilianBritishBritish West IndianBulgarianBurmeseCajunCambodianCanadianCape VerdeanCarpatho RusynCelticCentral AmericanCentral American IndianCherokeeCheyenneChickasawChileanChineseChippewaChoctawColombianColvilleComancheCosta RicanCreeCreekCroatianCrowCubanCzechCzechoslovakianDanishDelawareDominicanDutchDutch West IndianEastern EuropeanEcuadorianEgyptianEnglishEstonianEthiopianEuropeanFijianFilipinoFinnishFrenchFrench American IndianFrench CanadianGermanGerman RussianGhanaianGreekGuamanian/ChamorroGuatemalanGuyaneseHaitianHmongHonduranHopiHoumaHungarianIcelanderIndian (Asian)IndonesianInupiatIranianIraqiIrishIroquoisIsraeliItalianJamaicanJapaneseJordanianKenyanKiowaKoreanLaotianLatvianLebaneseLiberianLithuanianLumbeeLuxembourgerMacedonianMalaysianMalteseMarshalleseMenomineeMexicanMexican American IndianMongolianMoroccanNative HawaiianNavajoNepaleseNew ZealanderNicaraguanNigerianNorthern EuropeanNorwegianOkinawanOsageOttawaPaiutePakistaniPalestinianPanamanianParaguayanPennsylvania GermanPeruvianPimaPolishPortuguesePotawatomiPuebloPuerto RicanPuget Sound SalishRomanianRussianSalvadoranSamoanScandinavianScotch-IrishScottishSeminoleSenegaleseSerbianShoshoneSierra LeoneanSiouxSlavicSlovakSloveneSomaliSouth AfricanSouth AmericanSouth American IndianSoviet UnionSpaniardSpanishSpanish AmericanSpanish American IndianSri LankanSubsaharan AfricanSudaneseSwedishSwissSyrianTaiwaneseThaiTlingit-HaidaTohono O'OdhamTonganTrinidadian and TobagonianTsimshianTurkishU.S. Virgin IslanderUgandanUkrainianUruguayanUteVenezuelanVietnameseWelshWest IndianYakamaYaquiYugoslavianYumanYup'ikZimbabwean
Immigration
NonimmigrantsImmigrantsAfghanistanAfricaAlbaniaArgentinaArmeniaAsiaAustraliaAustriaBahamasBangladeshBarbadosBelarusBelgiumBelizeBoliviaBosnia and HerzegovinaBrazilBulgariaBurma/MyanmarCabo VerdeCambodiaCameroonCanadaCaribbeanCentral AmericaChileChinaColombiaCongoCosta RicaCroatiaCubaCzechoslovakiaDenmarkDominicaDominican RepublicEastern AfricaEastern AsiaEastern EuropeEcuadorEgyptEl SalvadorEnglandEritreaEthiopiaEuropeFijiFranceGermanyGhanaGreeceGrenadaGuatemalaGuyanaHaitiHondurasHong KongHungaryIndiaIndonesiaIranIraqIrelandIsraelItalyJamaicaJapanJordanKazakhstanKenyaKoreaKuwaitLaosLatin AmericaLatviaLebanonLiberiaLithuaniaMalaysiaMexicoMicronesiaMiddle AfricaMoldovaMoroccoNepalNetherlandsNicaraguaNigeriaNorth AmericaNorth MacedoniaNorthern AfricaNorthern EuropeNorwayOceaniaPakistanPanamaPeruPhilippinesPolandPortugalRomaniaRussiaSaudi ArabiaScotlandSenegalSerbiaSierra LeoneSingaporeSomaliaSouth AfricaSouth AmericaSouth Central AsiaSouth Eastern AsiaSouthern EuropeSpainSri LankaSt. Vincent and the GrenadinesSudanSwedenSwitzerlandSyriaTaiwanThailandTrinidad and TobagoTurkeyUgandaUkraineUruguayUzbekistanVenezuelaVietnamWest IndiesWestern AfricaWestern AsiaWestern EuropeYemenZaireZimbabweAzores
Cypriot
Race
Ancestry
AfghanAfricanAlaska NativeAlaskan AthabascanAlbanianAleutAlsatianAmericanApacheArabArapahoArgentineanArmenianAssyrian/Chaldean/SyriacAustralianAustrianBahamianBangladeshiBarbadianBasqueBelgianBelizeanBermudanBhutaneseBlackfeetBolivianBrazilianBritishBritish West IndianBulgarianBurmeseCajunCambodianCanadianCape VerdeanCarpatho RusynCelticCentral AmericanCentral American IndianCherokeeCheyenneChickasawChileanChineseChippewaChoctawColombianColvilleComancheCosta RicanCreeCreekCroatianCrowCubanCypriotCzechCzechoslovakianDanishDelawareDominicanDutchDutch West IndianEastern EuropeanEcuadorianEgyptianEnglishEstonianEthiopianEuropeanFijianFilipinoFinnishFrenchFrench American IndianFrench CanadianGermanGerman RussianGhanaianGreekGuamanian/ChamorroGuatemalanGuyaneseHaitianHmongHonduranHopiHoumaHungarianIcelanderIndian (Asian)IndonesianInupiatIranianIraqiIrishIroquoisIsraeliItalianJamaicanJapaneseJordanianKenyanKiowaKoreanLaotianLatvianLebaneseLiberianLithuanianLumbeeLuxembourgerMacedonianMalaysianMalteseMarshalleseMenomineeMexicanMexican American IndianMongolianMoroccanNative HawaiianNavajoNepaleseNew ZealanderNicaraguanNigerianNorthern EuropeanNorwegianOkinawanOsageOttawaPaiutePakistaniPalestinianPanamanianParaguayanPennsylvania GermanPeruvianPimaPolishPortuguesePotawatomiPuebloPuerto RicanPuget Sound SalishRomanianRussianSalvadoranSamoanScandinavianScotch-IrishScottishSenegaleseSerbianShoshoneSierra LeoneanSiouxSlavicSlovakSloveneSomaliSouth AfricanSouth AmericanSouth American IndianSoviet UnionSpaniardSpanishSpanish AmericanSpanish American IndianSri LankanSubsaharan AfricanSudaneseSwedishSwissSyrianTaiwaneseThaiTlingit-HaidaTohono O'OdhamTonganTrinidadian and TobagonianTsimshianTurkishU.S. Virgin IslanderUgandanUkrainianUruguayanUteVenezuelanVietnameseWelshWest IndianYakamaYaquiYugoslavianYumanYup'ikZimbabwean
Immigration
NonimmigrantsImmigrantsAfghanistanAfricaAlbaniaArgentinaArmeniaAsiaAustraliaAustriaBahamasBangladeshBarbadosBelarusBelgiumBelizeBoliviaBosnia and HerzegovinaBrazilBulgariaBurma/MyanmarCabo VerdeCambodiaCameroonCanadaCaribbeanCentral AmericaChileChinaColombiaCongoCosta RicaCroatiaCubaCzechoslovakiaDenmarkDominicaDominican RepublicEastern AfricaEastern AsiaEastern EuropeEcuadorEgyptEl SalvadorEnglandEritreaEthiopiaEuropeFijiFranceGermanyGhanaGreeceGrenadaGuatemalaGuyanaHaitiHondurasHong KongHungaryIndiaIndonesiaIranIraqIrelandIsraelItalyJamaicaJapanJordanKazakhstanKenyaKoreaKuwaitLaosLatin AmericaLatviaLebanonLiberiaLithuaniaMalaysiaMexicoMicronesiaMiddle AfricaMoldovaMoroccoNepalNetherlandsNicaraguaNigeriaNorth AmericaNorth MacedoniaNorthern AfricaNorthern EuropeNorwayOceaniaPakistanPanamaPeruPhilippinesPolandPortugalRomaniaRussiaSaudi ArabiaScotlandSenegalSerbiaSierra LeoneSingaporeSomaliaSouth AfricaSouth AmericaSouth Central AsiaSouth Eastern AsiaSouthern EuropeSpainSri LankaSt. Vincent and the GrenadinesSudanSwedenSwitzerlandSyriaTaiwanThailandTrinidad and TobagoTurkeyUgandaUkraineUruguayUzbekistanVenezuelaVietnamWest IndiesWestern AfricaWestern AsiaWestern EuropeYemenZaireZimbabweAzores
Unemployment Among Seniors over 65 years
Income
Poverty
Unemployment
Labor Participation
Family Structure
Vehicle Availability
Education Level
Disability

Unemployment Among Seniors over 65 years Comparison

Seminole

Cypriots

Exceptional
Tragic
5.0%
UNEMPLOYMENT AMONG SENIORS OVER 65 YEARS
91.4/ 100
METRIC RATING
113th/ 347
METRIC RANK
5.4%
UNEMPLOYMENT AMONG SENIORS OVER 65 YEARS
0.1/ 100
METRIC RATING
271st/ 347
METRIC RANK

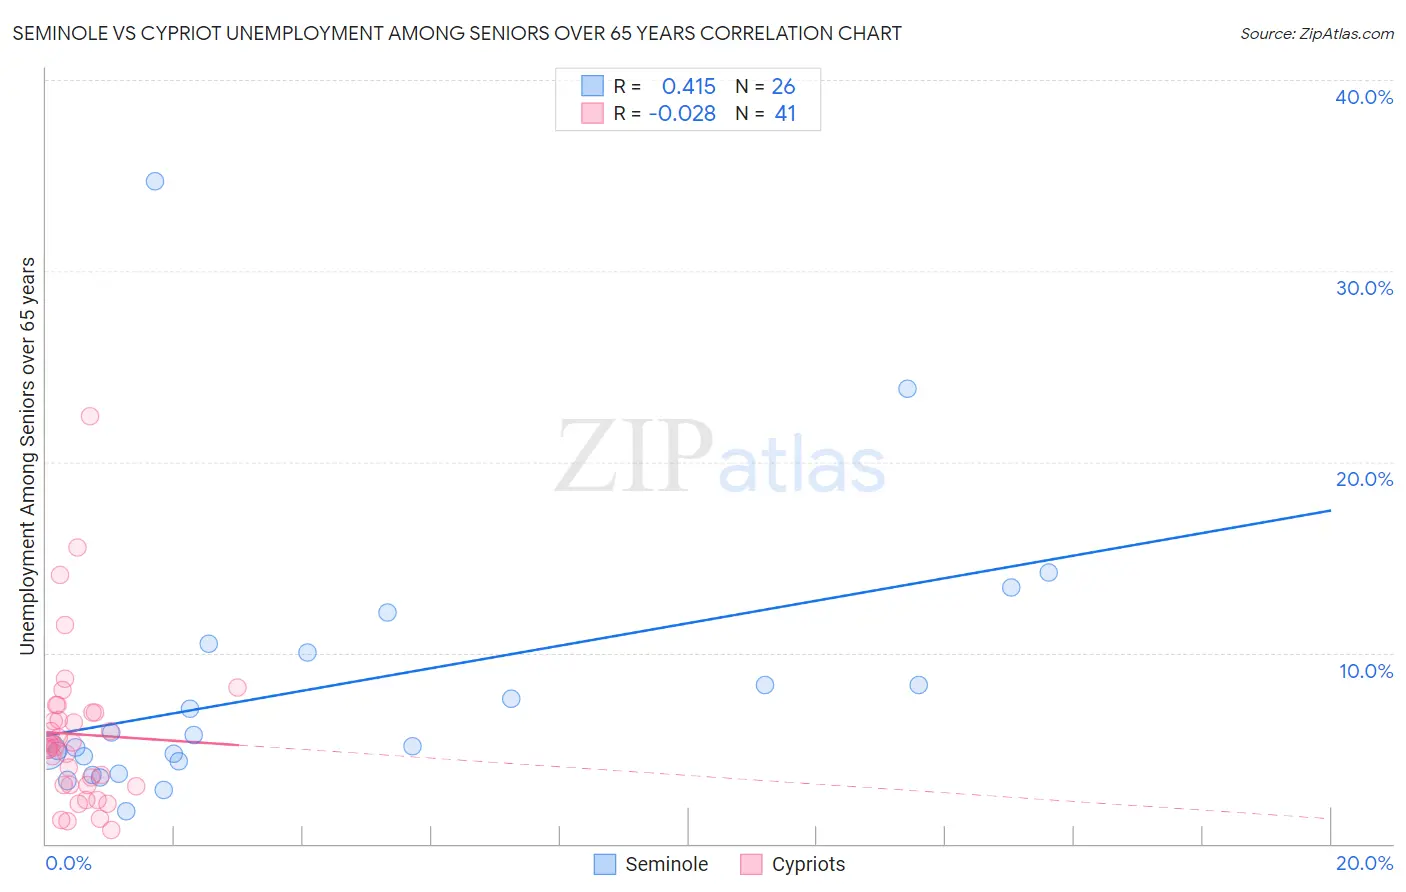
Seminole vs Cypriot Unemployment Among Seniors over 65 years Correlation Chart

The statistical analysis conducted on geographies consisting of 112,443,018 people shows a moderate positive correlation between the proportion of Seminole and unemployment rate amomg seniors over the age of 65 in the United States with a correlation coefficient (R) of 0.415 and weighted average of 5.0%. Similarly, the statistical analysis conducted on geographies consisting of 60,521,367 people shows no correlation between the proportion of Cypriots and unemployment rate amomg seniors over the age of 65 in the United States with a correlation coefficient (R) of -0.028 and weighted average of 5.4%, a difference of 7.5%.
Seminole vs Cypriot Unemployment Among Seniors over 65 years

Unemployment Among Seniors over 65 years Correlation Summary

MeasurementSeminoleCypriot
Minimum1.7%0.70%
Maximum34.7%22.4%
Range33.0%21.7%
Mean8.2%5.7%
Median5.4%5.2%
Interquartile 25% (IQ1)4.3%3.1%
Interquartile 75% (IQ3)10.0%6.9%
Interquartile Range (IQR)5.7%3.8%
Standard Deviation (Sample)7.2%4.1%
Standard Deviation (Population)7.0%4.1%

Similar Demographics by Unemployment Among Seniors over 65 years

Demographics Similar to Seminole by Unemployment Among Seniors over 65 years

In terms of unemployment among seniors over 65 years, the demographic groups most similar to Seminole are Immigrants from Latvia (5.0%, a difference of 0.0%), Celtic (5.0%, a difference of 0.010%), Immigrants from Korea (5.0%, a difference of 0.040%), Eastern European (5.0%, a difference of 0.060%), and Finnish (5.0%, a difference of 0.080%).
DemographicsRating | RankUnemployment Among Seniors over 65 years
Immigrants | Turkey
94.3
/100
|
#106
Exceptional
5.0%
Immigrants | Germany
93.2
/100
|
#107
Exceptional
5.0%
Immigrants | Vietnam
92.9
/100
|
#108
Exceptional
5.0%
Immigrants | Malaysia
92.7
/100
|
#109
Exceptional
5.0%
Immigrants | Saudi Arabia
92.7
/100
|
#110
Exceptional
5.0%
Finns
92.2
/100
|
#111
Exceptional
5.0%
Eastern Europeans
92.0
/100
|
#112
Exceptional
5.0%
Seminole
91.4
/100
|
#113
Exceptional
5.0%
Immigrants | Latvia
91.4
/100
|
#114
Exceptional
5.0%
Celtics
91.3
/100
|
#115
Exceptional
5.0%
Immigrants | Korea
91.0
/100
|
#116
Exceptional
5.0%
Malaysians
90.4
/100
|
#117
Exceptional
5.1%
Soviet Union
90.1
/100
|
#118
Exceptional
5.1%
Immigrants | Canada
89.7
/100
|
#119
Excellent
5.1%
Irish
88.8
/100
|
#120
Excellent
5.1%

Demographics Similar to Cypriots by Unemployment Among Seniors over 65 years

In terms of unemployment among seniors over 65 years, the demographic groups most similar to Cypriots are Immigrants from Jamaica (5.4%, a difference of 0.0%), Immigrants from Morocco (5.4%, a difference of 0.010%), Immigrants from Nigeria (5.4%, a difference of 0.010%), Immigrants from Brazil (5.4%, a difference of 0.050%), and Immigrants from Southern Europe (5.4%, a difference of 0.080%).
DemographicsRating | RankUnemployment Among Seniors over 65 years
Central American Indians
0.2
/100
|
#264
Tragic
5.4%
Immigrants | Colombia
0.2
/100
|
#265
Tragic
5.4%
Pennsylvania Germans
0.2
/100
|
#266
Tragic
5.4%
Chippewa
0.2
/100
|
#267
Tragic
5.4%
Hawaiians
0.1
/100
|
#268
Tragic
5.4%
Immigrants | Southern Europe
0.1
/100
|
#269
Tragic
5.4%
Immigrants | Morocco
0.1
/100
|
#270
Tragic
5.4%
Cypriots
0.1
/100
|
#271
Tragic
5.4%
Immigrants | Jamaica
0.1
/100
|
#272
Tragic
5.4%
Immigrants | Nigeria
0.1
/100
|
#273
Tragic
5.4%
Immigrants | Brazil
0.1
/100
|
#274
Tragic
5.4%
Mexican American Indians
0.1
/100
|
#275
Tragic
5.4%
Pueblo
0.1
/100
|
#276
Tragic
5.4%
Immigrants | Western Africa
0.1
/100
|
#277
Tragic
5.4%
Colville
0.1
/100
|
#278
Tragic
5.4%