Scottish vs Yaqui Unemployment Among Ages 20 to 24 years
COMPARE
Scottish
Yaqui
Unemployment Among Ages 20 to 24 years
Unemployment Among Ages 20 to 24 years Comparison
Scottish
Yaqui
9.8%
UNEMPLOYMENT AMONG AGES 20 TO 24 YEARS
99.3/ 100
METRIC RATING
66th/ 347
METRIC RANK
9.9%
UNEMPLOYMENT AMONG AGES 20 TO 24 YEARS
98.0/ 100
METRIC RATING
81st/ 347
METRIC RANK
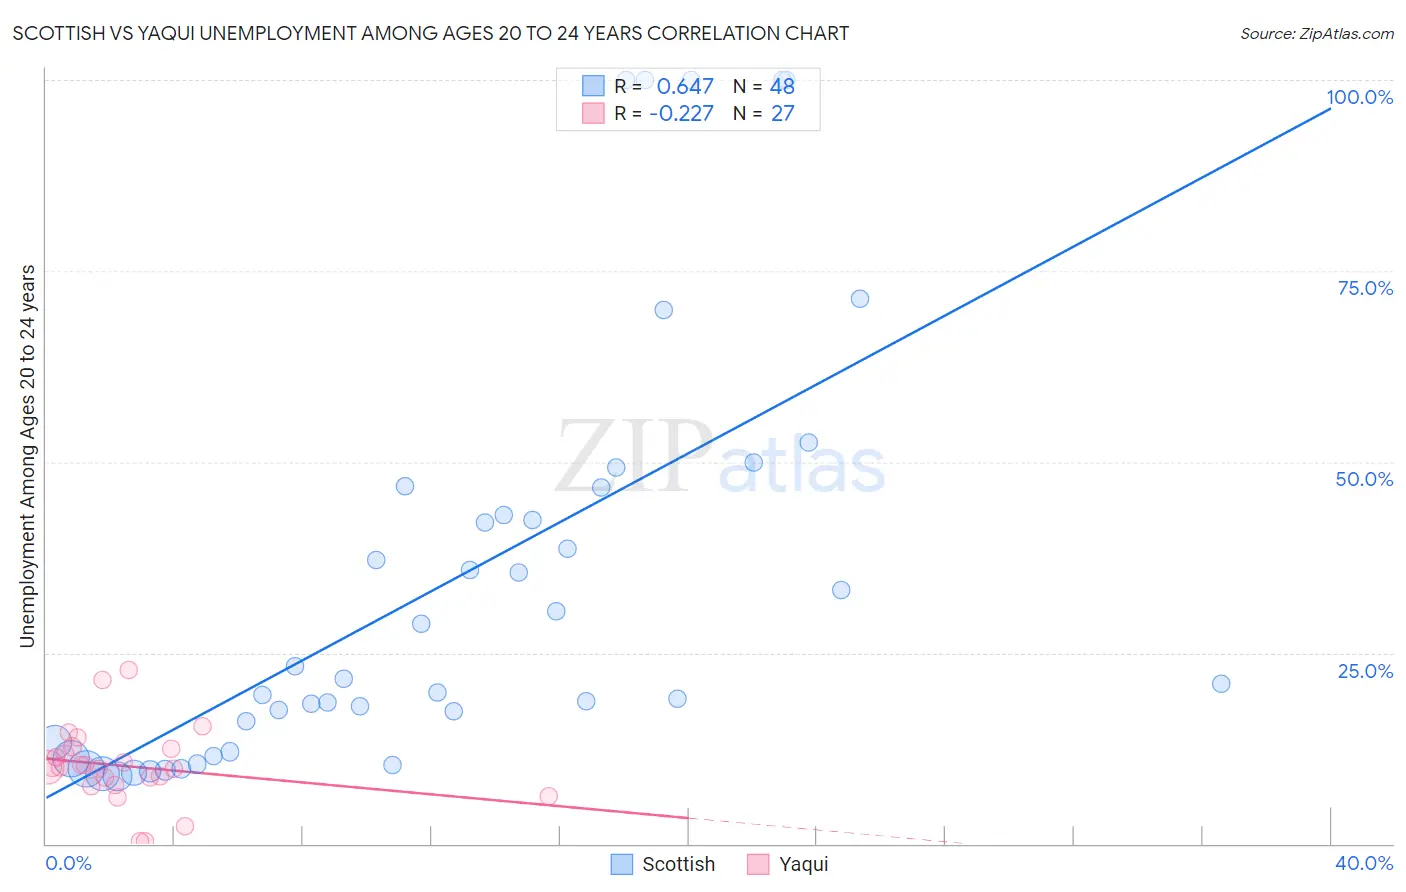
Scottish vs Yaqui Unemployment Among Ages 20 to 24 years Correlation Chart
The statistical analysis conducted on geographies consisting of 518,915,873 people shows a significant positive correlation between the proportion of Scottish and unemployment rate among population between the ages 20 and 24 in the United States with a correlation coefficient (R) of 0.647 and weighted average of 9.8%. Similarly, the statistical analysis conducted on geographies consisting of 106,774,031 people shows a weak negative correlation between the proportion of Yaqui and unemployment rate among population between the ages 20 and 24 in the United States with a correlation coefficient (R) of -0.227 and weighted average of 9.9%, a difference of 1.0%.
Unemployment Among Ages 20 to 24 years Correlation Summary
| Measurement | Scottish | Yaqui |
| Minimum | 8.8% | 0.40% |
| Maximum | 100.0% | 22.7% |
| Range | 91.2% | 22.3% |
| Mean | 34.1% | 10.1% |
| Median | 21.3% | 10.0% |
| Interquartile 25% (IQ1) | 12.6% | 7.6% |
| Interquartile 75% (IQ3) | 44.9% | 12.4% |
| Interquartile Range (IQR) | 32.2% | 4.8% |
| Standard Deviation (Sample) | 27.7% | 5.1% |
| Standard Deviation (Population) | 27.4% | 5.0% |
Demographics Similar to Scottish and Yaqui by Unemployment Among Ages 20 to 24 years
In terms of unemployment among ages 20 to 24 years, the demographic groups most similar to Scottish are Welsh (9.8%, a difference of 0.080%), Immigrants from Bolivia (9.9%, a difference of 0.11%), British (9.8%, a difference of 0.15%), Serbian (9.8%, a difference of 0.15%), and Mongolian (9.9%, a difference of 0.17%). Similarly, the demographic groups most similar to Yaqui are Sri Lankan (9.9%, a difference of 0.0%), Immigrants from Bulgaria (9.9%, a difference of 0.020%), Immigrants from Netherlands (9.9%, a difference of 0.11%), Icelander (9.9%, a difference of 0.16%), and Assyrian/Chaldean/Syriac (9.9%, a difference of 0.18%).
| Demographics | Rating | Rank | Unemployment Among Ages 20 to 24 years |
| British | 99.4 /100 | #63 | Exceptional 9.8% |
| Serbians | 99.4 /100 | #64 | Exceptional 9.8% |
| Welsh | 99.3 /100 | #65 | Exceptional 9.8% |
| Scottish | 99.3 /100 | #66 | Exceptional 9.8% |
| Immigrants | Bolivia | 99.2 /100 | #67 | Exceptional 9.9% |
| Mongolians | 99.1 /100 | #68 | Exceptional 9.9% |
| Bulgarians | 99.1 /100 | #69 | Exceptional 9.9% |
| Immigrants | Croatia | 99.0 /100 | #70 | Exceptional 9.9% |
| Celtics | 98.9 /100 | #71 | Exceptional 9.9% |
| Bolivians | 98.9 /100 | #72 | Exceptional 9.9% |
| Kenyans | 98.7 /100 | #73 | Exceptional 9.9% |
| Immigrants | Laos | 98.7 /100 | #74 | Exceptional 9.9% |
| Immigrants | Australia | 98.6 /100 | #75 | Exceptional 9.9% |
| Czechoslovakians | 98.4 /100 | #76 | Exceptional 9.9% |
| Chickasaw | 98.4 /100 | #77 | Exceptional 9.9% |
| Assyrians/Chaldeans/Syriacs | 98.3 /100 | #78 | Exceptional 9.9% |
| Icelanders | 98.3 /100 | #79 | Exceptional 9.9% |
| Immigrants | Netherlands | 98.2 /100 | #80 | Exceptional 9.9% |
| Yaqui | 98.0 /100 | #81 | Exceptional 9.9% |
| Sri Lankans | 98.0 /100 | #82 | Exceptional 9.9% |
| Immigrants | Bulgaria | 98.0 /100 | #83 | Exceptional 9.9% |