Immigrants from Uzbekistan vs Spanish American Indian Unemployment Among Women with Children Under 6 years
COMPARE
Immigrants from Uzbekistan
Spanish American Indian
Unemployment Among Women with Children Under 6 years
Unemployment Among Women with Children Under 6 years Comparison
Immigrants from Uzbekistan
Spanish American Indians
6.3%
UNEMPLOYMENT AMONG WOMEN WITH CHILDREN UNDER 6 YEARS
100.0/ 100
METRIC RATING
16th/ 347
METRIC RANK
8.7%
UNEMPLOYMENT AMONG WOMEN WITH CHILDREN UNDER 6 YEARS
0.0/ 100
METRIC RATING
283rd/ 347
METRIC RANK
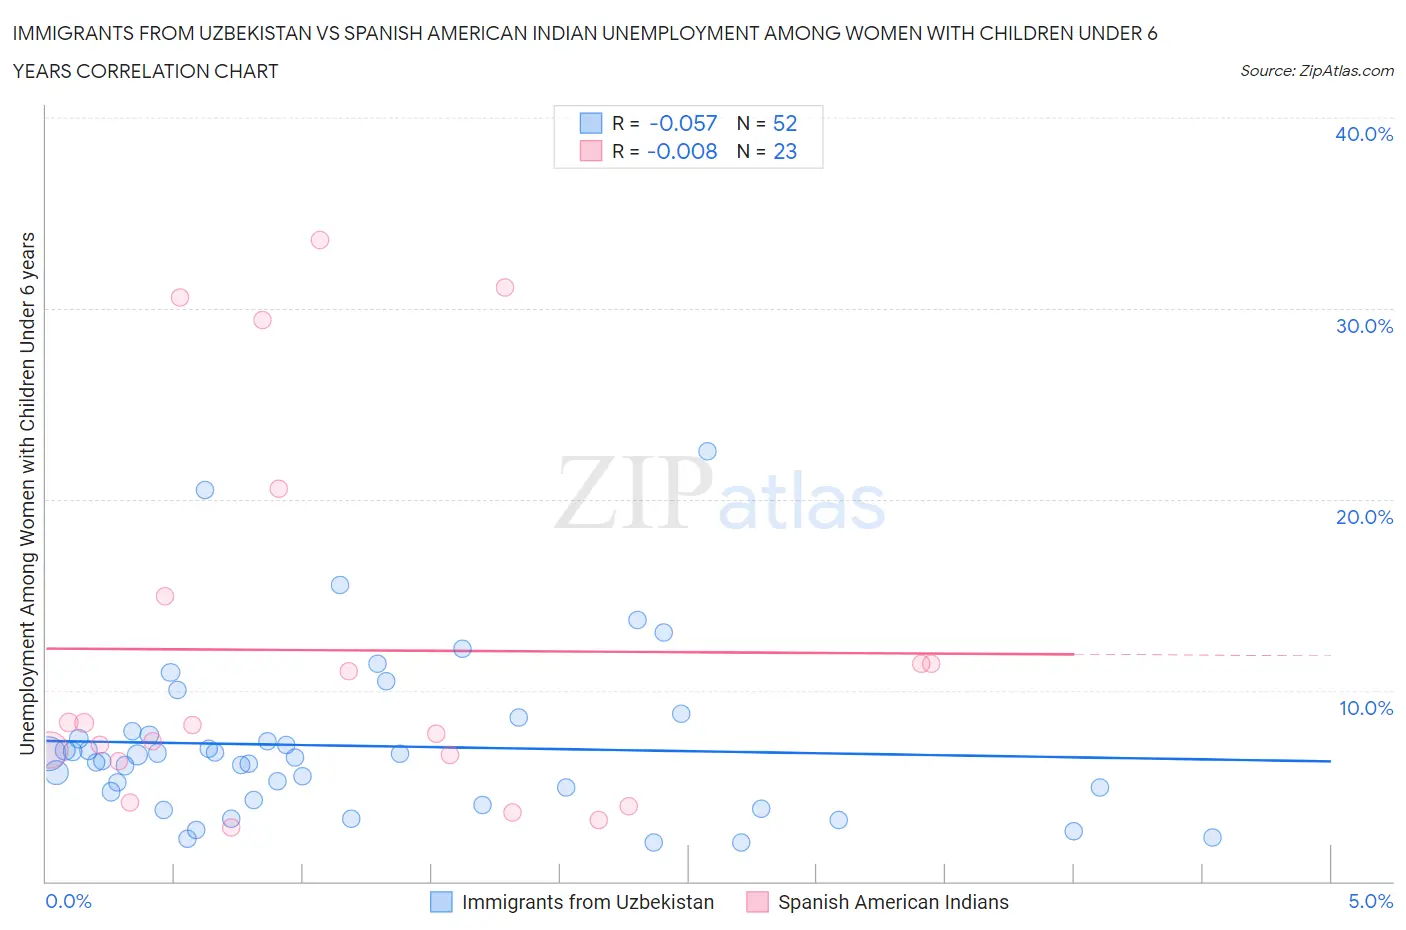
Immigrants from Uzbekistan vs Spanish American Indian Unemployment Among Women with Children Under 6 years Correlation Chart
The statistical analysis conducted on geographies consisting of 105,202,547 people shows a slight negative correlation between the proportion of Immigrants from Uzbekistan and unemployment rate among women with children under the age of 6 in the United States with a correlation coefficient (R) of -0.057 and weighted average of 6.3%. Similarly, the statistical analysis conducted on geographies consisting of 68,967,895 people shows no correlation between the proportion of Spanish American Indians and unemployment rate among women with children under the age of 6 in the United States with a correlation coefficient (R) of -0.008 and weighted average of 8.7%, a difference of 36.6%.
Unemployment Among Women with Children Under 6 years Correlation Summary
| Measurement | Immigrants from Uzbekistan | Spanish American Indian |
| Minimum | 2.0% | 2.8% |
| Maximum | 22.5% | 33.6% |
| Range | 20.5% | 30.8% |
| Mean | 7.1% | 12.1% |
| Median | 6.6% | 8.2% |
| Interquartile 25% (IQ1) | 4.5% | 6.3% |
| Interquartile 75% (IQ3) | 7.8% | 15.0% |
| Interquartile Range (IQR) | 3.3% | 8.6% |
| Standard Deviation (Sample) | 4.2% | 9.8% |
| Standard Deviation (Population) | 4.2% | 9.6% |
Similar Demographics by Unemployment Among Women with Children Under 6 years
Demographics Similar to Immigrants from Uzbekistan by Unemployment Among Women with Children Under 6 years
In terms of unemployment among women with children under 6 years, the demographic groups most similar to Immigrants from Uzbekistan are Thai (6.3%, a difference of 0.30%), Immigrants from Bulgaria (6.3%, a difference of 0.40%), Immigrants from Malaysia (6.4%, a difference of 0.67%), Immigrants from Eastern Asia (6.3%, a difference of 0.72%), and Immigrants from Singapore (6.3%, a difference of 0.78%).
| Demographics | Rating | Rank | Unemployment Among Women with Children Under 6 years |
| Filipinos | 100.0 /100 | #9 | Exceptional 6.1% |
| Immigrants | China | 100.0 /100 | #10 | Exceptional 6.2% |
| Indians (Asian) | 100.0 /100 | #11 | Exceptional 6.3% |
| Immigrants | Singapore | 100.0 /100 | #12 | Exceptional 6.3% |
| Immigrants | Eastern Asia | 100.0 /100 | #13 | Exceptional 6.3% |
| Immigrants | Bulgaria | 100.0 /100 | #14 | Exceptional 6.3% |
| Thais | 100.0 /100 | #15 | Exceptional 6.3% |
| Immigrants | Uzbekistan | 100.0 /100 | #16 | Exceptional 6.3% |
| Immigrants | Malaysia | 100.0 /100 | #17 | Exceptional 6.4% |
| Assyrians/Chaldeans/Syriacs | 100.0 /100 | #18 | Exceptional 6.5% |
| Mongolians | 100.0 /100 | #19 | Exceptional 6.5% |
| Ute | 100.0 /100 | #20 | Exceptional 6.5% |
| Burmese | 100.0 /100 | #21 | Exceptional 6.5% |
| Immigrants | Korea | 100.0 /100 | #22 | Exceptional 6.5% |
| Bulgarians | 100.0 /100 | #23 | Exceptional 6.5% |
Demographics Similar to Spanish American Indians by Unemployment Among Women with Children Under 6 years
In terms of unemployment among women with children under 6 years, the demographic groups most similar to Spanish American Indians are Bermudan (8.7%, a difference of 0.020%), Guatemalan (8.7%, a difference of 0.11%), Blackfeet (8.7%, a difference of 0.16%), Immigrants from Belize (8.6%, a difference of 0.25%), and Immigrants from Guatemala (8.6%, a difference of 0.29%).
| Demographics | Rating | Rank | Unemployment Among Women with Children Under 6 years |
| Yaqui | 0.0 /100 | #276 | Tragic 8.6% |
| Haitians | 0.0 /100 | #277 | Tragic 8.6% |
| Immigrants | Dominica | 0.0 /100 | #278 | Tragic 8.6% |
| Immigrants | Guatemala | 0.0 /100 | #279 | Tragic 8.6% |
| Immigrants | Belize | 0.0 /100 | #280 | Tragic 8.6% |
| Guatemalans | 0.0 /100 | #281 | Tragic 8.7% |
| Bermudans | 0.0 /100 | #282 | Tragic 8.7% |
| Spanish American Indians | 0.0 /100 | #283 | Tragic 8.7% |
| Blackfeet | 0.0 /100 | #284 | Tragic 8.7% |
| U.S. Virgin Islanders | 0.0 /100 | #285 | Tragic 8.7% |
| Seminole | 0.0 /100 | #286 | Tragic 8.7% |
| Menominee | 0.0 /100 | #287 | Tragic 8.7% |
| Bahamians | 0.0 /100 | #288 | Tragic 8.7% |
| Iroquois | 0.0 /100 | #289 | Tragic 8.7% |
| Vietnamese | 0.0 /100 | #290 | Tragic 8.8% |