Scotch-Irish vs Immigrants from Jordan Unemployment Among Ages 45 to 54 years
COMPARE
Scotch-Irish
Immigrants from Jordan
Unemployment Among Ages 45 to 54 years
Unemployment Among Ages 45 to 54 years Comparison
Scotch-Irish
Immigrants from Jordan
4.2%
UNEMPLOYMENT AMONG AGES 45 TO 54 YEARS
99.8/ 100
METRIC RATING
38th/ 347
METRIC RANK
4.3%
UNEMPLOYMENT AMONG AGES 45 TO 54 YEARS
99.3/ 100
METRIC RATING
56th/ 347
METRIC RANK
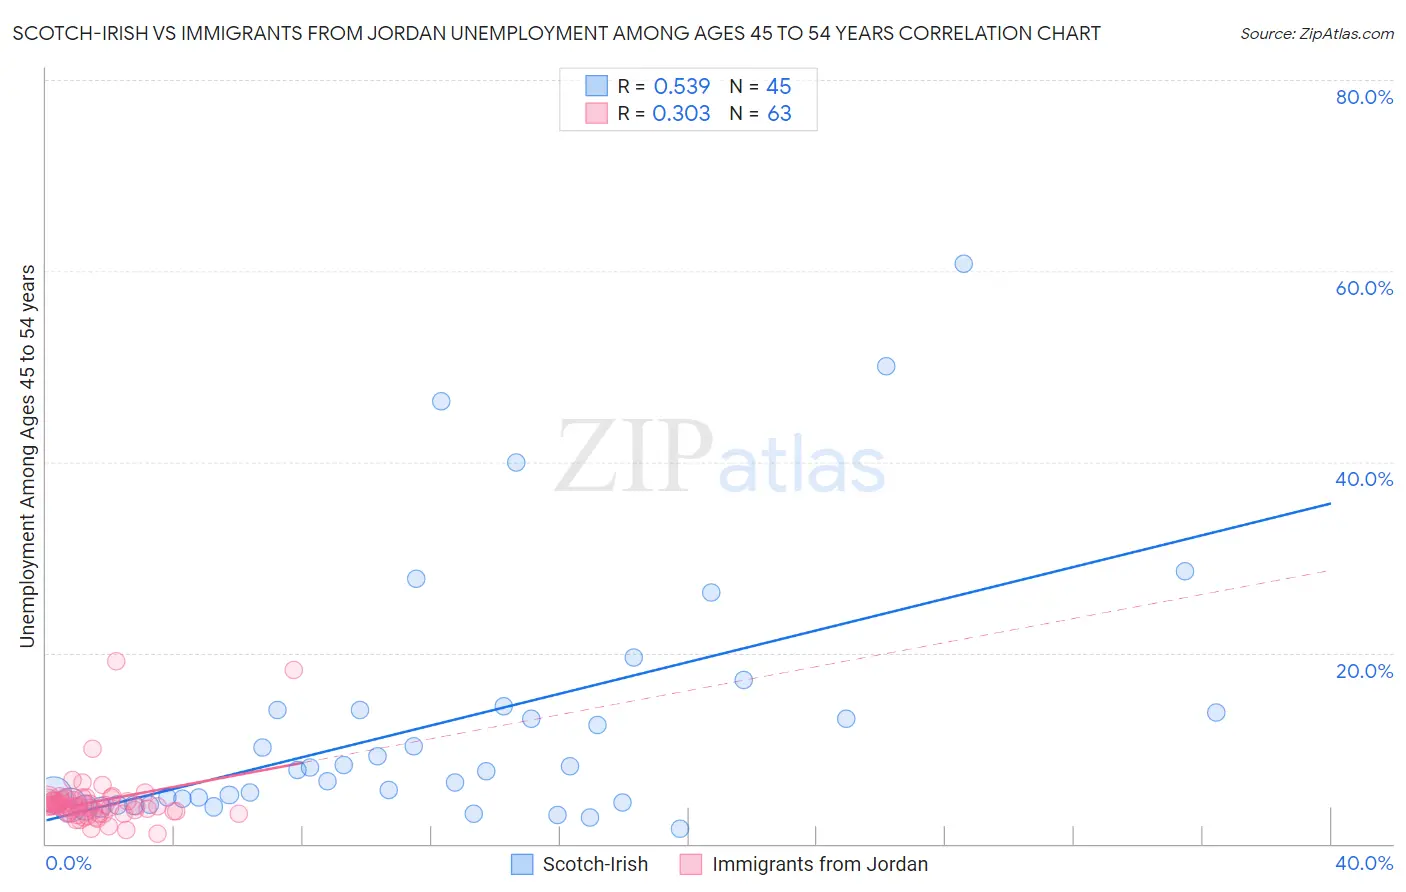
Scotch-Irish vs Immigrants from Jordan Unemployment Among Ages 45 to 54 years Correlation Chart
The statistical analysis conducted on geographies consisting of 510,401,780 people shows a substantial positive correlation between the proportion of Scotch-Irish and unemployment rate among population between the ages 45 and 54 in the United States with a correlation coefficient (R) of 0.539 and weighted average of 4.2%. Similarly, the statistical analysis conducted on geographies consisting of 179,872,671 people shows a mild positive correlation between the proportion of Immigrants from Jordan and unemployment rate among population between the ages 45 and 54 in the United States with a correlation coefficient (R) of 0.303 and weighted average of 4.3%, a difference of 1.7%.
Unemployment Among Ages 45 to 54 years Correlation Summary
| Measurement | Scotch-Irish | Immigrants from Jordan |
| Minimum | 1.6% | 1.1% |
| Maximum | 60.7% | 19.1% |
| Range | 59.1% | 18.0% |
| Mean | 12.7% | 4.4% |
| Median | 7.8% | 4.0% |
| Interquartile 25% (IQ1) | 4.2% | 3.2% |
| Interquartile 75% (IQ3) | 14.0% | 4.6% |
| Interquartile Range (IQR) | 9.8% | 1.4% |
| Standard Deviation (Sample) | 13.4% | 2.9% |
| Standard Deviation (Population) | 13.3% | 2.9% |
Demographics Similar to Scotch-Irish and Immigrants from Jordan by Unemployment Among Ages 45 to 54 years
In terms of unemployment among ages 45 to 54 years, the demographic groups most similar to Scotch-Irish are Osage (4.2%, a difference of 0.010%), Jordanian (4.2%, a difference of 0.15%), Northern European (4.2%, a difference of 0.34%), Czechoslovakian (4.2%, a difference of 0.36%), and Immigrants from Scotland (4.2%, a difference of 0.40%). Similarly, the demographic groups most similar to Immigrants from Jordan are Immigrants from Sri Lanka (4.3%, a difference of 0.060%), Latvian (4.2%, a difference of 0.16%), Irish (4.2%, a difference of 0.28%), Chickasaw (4.2%, a difference of 0.28%), and Polish (4.2%, a difference of 0.33%).
| Demographics | Rating | Rank | Unemployment Among Ages 45 to 54 years |
| Osage | 99.8 /100 | #37 | Exceptional 4.2% |
| Scotch-Irish | 99.8 /100 | #38 | Exceptional 4.2% |
| Jordanians | 99.8 /100 | #39 | Exceptional 4.2% |
| Northern Europeans | 99.8 /100 | #40 | Exceptional 4.2% |
| Czechoslovakians | 99.8 /100 | #41 | Exceptional 4.2% |
| Immigrants | Scotland | 99.8 /100 | #42 | Exceptional 4.2% |
| Zimbabweans | 99.8 /100 | #43 | Exceptional 4.2% |
| Immigrants | Singapore | 99.7 /100 | #44 | Exceptional 4.2% |
| Immigrants | Bulgaria | 99.7 /100 | #45 | Exceptional 4.2% |
| Luxembourgers | 99.6 /100 | #46 | Exceptional 4.2% |
| Filipinos | 99.6 /100 | #47 | Exceptional 4.2% |
| Finns | 99.6 /100 | #48 | Exceptional 4.2% |
| Immigrants | Zimbabwe | 99.6 /100 | #49 | Exceptional 4.2% |
| Basques | 99.6 /100 | #50 | Exceptional 4.2% |
| Burmese | 99.6 /100 | #51 | Exceptional 4.2% |
| Poles | 99.5 /100 | #52 | Exceptional 4.2% |
| Irish | 99.5 /100 | #53 | Exceptional 4.2% |
| Chickasaw | 99.5 /100 | #54 | Exceptional 4.2% |
| Latvians | 99.4 /100 | #55 | Exceptional 4.2% |
| Immigrants | Jordan | 99.3 /100 | #56 | Exceptional 4.3% |
| Immigrants | Sri Lanka | 99.3 /100 | #57 | Exceptional 4.3% |