Immigrants from Kenya vs Immigrants from Jordan Unemployment Among Ages 45 to 54 years
COMPARE
Immigrants from Kenya
Immigrants from Jordan
Unemployment Among Ages 45 to 54 years
Unemployment Among Ages 45 to 54 years Comparison
Immigrants from Kenya
Immigrants from Jordan
4.4%
UNEMPLOYMENT AMONG AGES 45 TO 54 YEARS
92.8/ 100
METRIC RATING
105th/ 347
METRIC RANK
4.3%
UNEMPLOYMENT AMONG AGES 45 TO 54 YEARS
99.3/ 100
METRIC RATING
56th/ 347
METRIC RANK
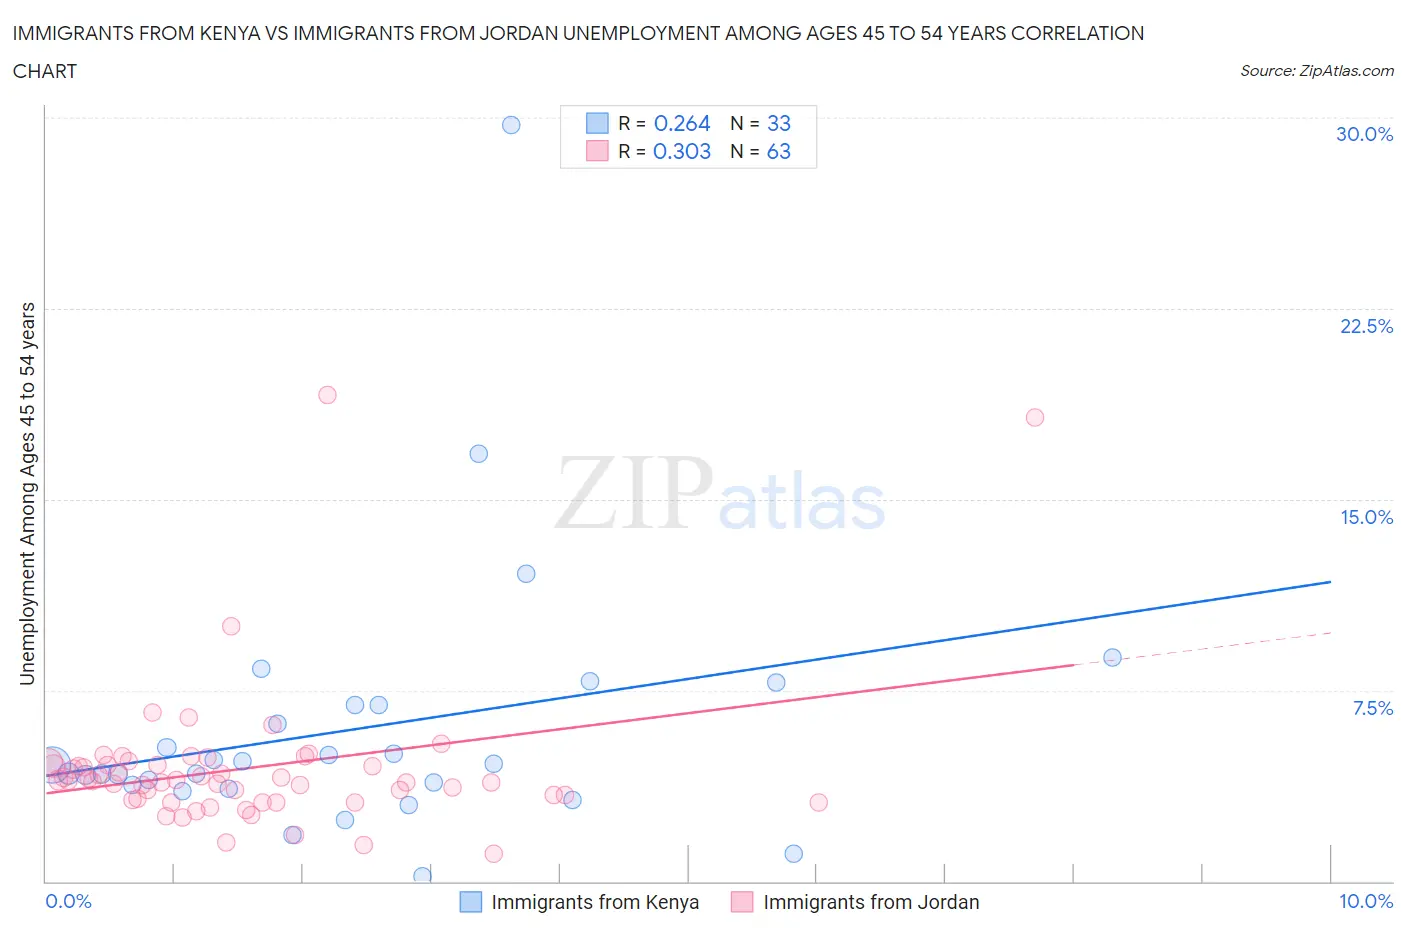
Immigrants from Kenya vs Immigrants from Jordan Unemployment Among Ages 45 to 54 years Correlation Chart
The statistical analysis conducted on geographies consisting of 215,539,788 people shows a weak positive correlation between the proportion of Immigrants from Kenya and unemployment rate among population between the ages 45 and 54 in the United States with a correlation coefficient (R) of 0.264 and weighted average of 4.4%. Similarly, the statistical analysis conducted on geographies consisting of 179,872,671 people shows a mild positive correlation between the proportion of Immigrants from Jordan and unemployment rate among population between the ages 45 and 54 in the United States with a correlation coefficient (R) of 0.303 and weighted average of 4.3%, a difference of 3.0%.
Unemployment Among Ages 45 to 54 years Correlation Summary
| Measurement | Immigrants from Kenya | Immigrants from Jordan |
| Minimum | 0.20% | 1.1% |
| Maximum | 29.7% | 19.1% |
| Range | 29.5% | 18.0% |
| Mean | 6.0% | 4.4% |
| Median | 4.6% | 4.0% |
| Interquartile 25% (IQ1) | 3.7% | 3.2% |
| Interquartile 75% (IQ3) | 6.9% | 4.6% |
| Interquartile Range (IQR) | 3.2% | 1.4% |
| Standard Deviation (Sample) | 5.3% | 2.9% |
| Standard Deviation (Population) | 5.2% | 2.9% |
Similar Demographics by Unemployment Among Ages 45 to 54 years
Demographics Similar to Immigrants from Kenya by Unemployment Among Ages 45 to 54 years
In terms of unemployment among ages 45 to 54 years, the demographic groups most similar to Immigrants from Kenya are Immigrants from Sweden (4.4%, a difference of 0.020%), Iranian (4.4%, a difference of 0.060%), Immigrants from South Africa (4.4%, a difference of 0.060%), Russian (4.4%, a difference of 0.12%), and Icelander (4.4%, a difference of 0.13%).
| Demographics | Rating | Rank | Unemployment Among Ages 45 to 54 years |
| Romanians | 94.9 /100 | #98 | Exceptional 4.4% |
| Immigrants | Burma/Myanmar | 94.9 /100 | #99 | Exceptional 4.4% |
| Immigrants | Eritrea | 94.7 /100 | #100 | Exceptional 4.4% |
| Immigrants | North America | 93.9 /100 | #101 | Exceptional 4.4% |
| Sri Lankans | 93.7 /100 | #102 | Exceptional 4.4% |
| Icelanders | 93.5 /100 | #103 | Exceptional 4.4% |
| Immigrants | Sweden | 93.0 /100 | #104 | Exceptional 4.4% |
| Immigrants | Kenya | 92.8 /100 | #105 | Exceptional 4.4% |
| Iranians | 92.5 /100 | #106 | Exceptional 4.4% |
| Immigrants | South Africa | 92.5 /100 | #107 | Exceptional 4.4% |
| Russians | 92.1 /100 | #108 | Exceptional 4.4% |
| New Zealanders | 91.9 /100 | #109 | Exceptional 4.4% |
| Immigrants | England | 91.3 /100 | #110 | Exceptional 4.4% |
| Immigrants | Nicaragua | 91.3 /100 | #111 | Exceptional 4.4% |
| Immigrants | Saudi Arabia | 91.1 /100 | #112 | Exceptional 4.4% |
Demographics Similar to Immigrants from Jordan by Unemployment Among Ages 45 to 54 years
In terms of unemployment among ages 45 to 54 years, the demographic groups most similar to Immigrants from Jordan are Immigrants from Sri Lanka (4.3%, a difference of 0.060%), Greek (4.3%, a difference of 0.11%), Latvian (4.2%, a difference of 0.16%), Okinawan (4.3%, a difference of 0.18%), and Immigrants from Korea (4.3%, a difference of 0.22%).
| Demographics | Rating | Rank | Unemployment Among Ages 45 to 54 years |
| Immigrants | Zimbabwe | 99.6 /100 | #49 | Exceptional 4.2% |
| Basques | 99.6 /100 | #50 | Exceptional 4.2% |
| Burmese | 99.6 /100 | #51 | Exceptional 4.2% |
| Poles | 99.5 /100 | #52 | Exceptional 4.2% |
| Irish | 99.5 /100 | #53 | Exceptional 4.2% |
| Chickasaw | 99.5 /100 | #54 | Exceptional 4.2% |
| Latvians | 99.4 /100 | #55 | Exceptional 4.2% |
| Immigrants | Jordan | 99.3 /100 | #56 | Exceptional 4.3% |
| Immigrants | Sri Lanka | 99.3 /100 | #57 | Exceptional 4.3% |
| Greeks | 99.3 /100 | #58 | Exceptional 4.3% |
| Okinawans | 99.2 /100 | #59 | Exceptional 4.3% |
| Immigrants | Korea | 99.2 /100 | #60 | Exceptional 4.3% |
| Immigrants | Pakistan | 99.2 /100 | #61 | Exceptional 4.3% |
| Lithuanians | 99.1 /100 | #62 | Exceptional 4.3% |
| Pennsylvania Germans | 99.1 /100 | #63 | Exceptional 4.3% |