Immigrants from Yemen vs Immigrants from Jordan Unemployment Among Ages 45 to 54 years

COMPARE

Immigrants from Yemen
Race
Ancestry
AfghanAfricanAlaska NativeAlaskan AthabascanAlbanianAleutAlsatianAmericanApacheArabArapahoArgentineanArmenianAssyrian/Chaldean/SyriacAustralianAustrianBahamianBangladeshiBarbadianBasqueBelgianBelizeanBermudanBhutaneseBlackfeetBolivianBrazilianBritishBritish West IndianBulgarianBurmeseCajunCambodianCanadianCape VerdeanCarpatho RusynCelticCentral AmericanCentral American IndianCherokeeCheyenneChickasawChileanChineseChippewaChoctawColombianColvilleComancheCosta RicanCreeCreekCroatianCrowCubanCypriotCzechCzechoslovakianDanishDelawareDominicanDutchDutch West IndianEastern EuropeanEcuadorianEgyptianEnglishEstonianEthiopianEuropeanFijianFilipinoFinnishFrenchFrench American IndianFrench CanadianGermanGerman RussianGhanaianGreekGuamanian/ChamorroGuatemalanGuyaneseHaitianHmongHonduranHopiHoumaHungarianIcelanderIndian (Asian)IndonesianInupiatIranianIraqiIrishIroquoisIsraeliItalianJamaicanJapaneseJordanianKenyanKiowaKoreanLaotianLatvianLebaneseLiberianLithuanianLumbeeLuxembourgerMacedonianMalaysianMalteseMarshalleseMenomineeMexicanMexican American IndianMongolianMoroccanNative HawaiianNavajoNepaleseNew ZealanderNicaraguanNigerianNorthern EuropeanNorwegianOkinawanOsageOttawaPaiutePakistaniPalestinianPanamanianParaguayanPennsylvania GermanPeruvianPimaPolishPortuguesePotawatomiPuebloPuerto RicanPuget Sound SalishRomanianRussianSalvadoranSamoanScandinavianScotch-IrishScottishSeminoleSenegaleseSerbianShoshoneSierra LeoneanSiouxSlavicSlovakSloveneSomaliSouth AfricanSouth AmericanSouth American IndianSoviet UnionSpaniardSpanishSpanish AmericanSpanish American IndianSri LankanSubsaharan AfricanSudaneseSwedishSwissSyrianTaiwaneseThaiTlingit-HaidaTohono O'OdhamTonganTrinidadian and TobagonianTsimshianTurkishU.S. Virgin IslanderUgandanUkrainianUruguayanUteVenezuelanVietnameseWelshWest IndianYakamaYaquiYugoslavianYumanYup'ikZimbabwean
Immigration
NonimmigrantsImmigrantsAfghanistanAfricaAlbaniaArgentinaArmeniaAsiaAustraliaAustriaBahamasBangladeshBarbadosBelarusBelgiumBelizeBoliviaBosnia and HerzegovinaBrazilBulgariaBurma/MyanmarCabo VerdeCambodiaCameroonCanadaCaribbeanCentral AmericaChileChinaColombiaCongoCosta RicaCroatiaCubaCzechoslovakiaDenmarkDominicaDominican RepublicEastern AfricaEastern AsiaEastern EuropeEcuadorEgyptEl SalvadorEnglandEritreaEthiopiaEuropeFijiFranceGermanyGhanaGreeceGrenadaGuatemalaGuyanaHaitiHondurasHong KongHungaryIndiaIndonesiaIranIraqIrelandIsraelItalyJamaicaJapanKazakhstanKenyaKoreaKuwaitLaosLatin AmericaLatviaLebanonLiberiaLithuaniaMalaysiaMexicoMicronesiaMiddle AfricaMoldovaMoroccoNepalNetherlandsNicaraguaNigeriaNorth AmericaNorth MacedoniaNorthern AfricaNorthern EuropeNorwayOceaniaPakistanPanamaPeruPhilippinesPolandPortugalRomaniaRussiaSaudi ArabiaScotlandSenegalSerbiaSierra LeoneSingaporeSomaliaSouth AfricaSouth AmericaSouth Central AsiaSouth Eastern AsiaSouthern EuropeSpainSri LankaSt. Vincent and the GrenadinesSudanSwedenSwitzerlandSyriaTaiwanThailandTrinidad and TobagoTurkeyUgandaUkraineUruguayUzbekistanVenezuelaVietnamWest IndiesWestern AfricaWestern AsiaWestern EuropeYemenZaireZimbabweAzores
Immigrants from Jordan
Race
Ancestry
AfghanAfricanAlaska NativeAlaskan AthabascanAlbanianAleutAlsatianAmericanApacheArabArapahoArgentineanArmenianAssyrian/Chaldean/SyriacAustralianAustrianBahamianBangladeshiBarbadianBasqueBelgianBelizeanBermudanBhutaneseBlackfeetBolivianBrazilianBritishBritish West IndianBulgarianBurmeseCajunCambodianCanadianCape VerdeanCarpatho RusynCelticCentral AmericanCentral American IndianCherokeeCheyenneChickasawChileanChineseChippewaChoctawColombianColvilleComancheCosta RicanCreeCreekCroatianCrowCubanCypriotCzechCzechoslovakianDanishDelawareDominicanDutchDutch West IndianEastern EuropeanEcuadorianEgyptianEnglishEstonianEthiopianEuropeanFijianFilipinoFinnishFrenchFrench American IndianFrench CanadianGermanGerman RussianGhanaianGreekGuamanian/ChamorroGuatemalanGuyaneseHaitianHmongHonduranHopiHoumaHungarianIcelanderIndian (Asian)IndonesianInupiatIranianIraqiIrishIroquoisIsraeliItalianJamaicanJapaneseJordanianKenyanKiowaKoreanLaotianLatvianLebaneseLiberianLithuanianLumbeeLuxembourgerMacedonianMalaysianMalteseMarshalleseMenomineeMexicanMexican American IndianMongolianMoroccanNative HawaiianNavajoNepaleseNew ZealanderNicaraguanNigerianNorthern EuropeanNorwegianOkinawanOsageOttawaPaiutePakistaniPalestinianPanamanianParaguayanPennsylvania GermanPeruvianPimaPolishPortuguesePotawatomiPuebloPuerto RicanPuget Sound SalishRomanianRussianSalvadoranSamoanScandinavianScotch-IrishScottishSeminoleSenegaleseSerbianShoshoneSierra LeoneanSiouxSlavicSlovakSloveneSomaliSouth AfricanSouth AmericanSouth American IndianSoviet UnionSpaniardSpanishSpanish AmericanSpanish American IndianSri LankanSubsaharan AfricanSudaneseSwedishSwissSyrianTaiwaneseThaiTlingit-HaidaTohono O'OdhamTonganTrinidadian and TobagonianTsimshianTurkishU.S. Virgin IslanderUgandanUkrainianUruguayanUteVenezuelanVietnameseWelshWest IndianYakamaYaquiYugoslavianYumanYup'ikZimbabwean
Immigration
NonimmigrantsImmigrantsAfghanistanAfricaAlbaniaArgentinaArmeniaAsiaAustraliaAustriaBahamasBangladeshBarbadosBelarusBelgiumBelizeBoliviaBosnia and HerzegovinaBrazilBulgariaBurma/MyanmarCabo VerdeCambodiaCameroonCanadaCaribbeanCentral AmericaChileChinaColombiaCongoCosta RicaCroatiaCubaCzechoslovakiaDenmarkDominicaDominican RepublicEastern AfricaEastern AsiaEastern EuropeEcuadorEgyptEl SalvadorEnglandEritreaEthiopiaEuropeFijiFranceGermanyGhanaGreeceGrenadaGuatemalaGuyanaHaitiHondurasHong KongHungaryIndiaIndonesiaIranIraqIrelandIsraelItalyJamaicaJapanJordanKazakhstanKenyaKoreaKuwaitLaosLatin AmericaLatviaLebanonLiberiaLithuaniaMalaysiaMexicoMicronesiaMiddle AfricaMoldovaMoroccoNepalNetherlandsNicaraguaNigeriaNorth AmericaNorth MacedoniaNorthern AfricaNorthern EuropeNorwayOceaniaPakistanPanamaPeruPhilippinesPolandPortugalRomaniaRussiaSaudi ArabiaScotlandSenegalSerbiaSierra LeoneSingaporeSomaliaSouth AfricaSouth AmericaSouth Central AsiaSouth Eastern AsiaSouthern EuropeSpainSri LankaSt. Vincent and the GrenadinesSudanSwedenSwitzerlandSyriaTaiwanThailandTrinidad and TobagoTurkeyUgandaUkraineUruguayUzbekistanVenezuelaVietnamWest IndiesWestern AfricaWestern AsiaWestern EuropeZaireZimbabweAzores
Unemployment Among Ages 45 to 54 years
Income
Poverty
Unemployment
Labor Participation
Family Structure
Vehicle Availability
Education Level
Disability

Unemployment Among Ages 45 to 54 years Comparison

Immigrants from Yemen

Immigrants from Jordan

Tragic
Exceptional
6.5%
UNEMPLOYMENT AMONG AGES 45 TO 54 YEARS
0.0/ 100
METRIC RATING
333rd/ 347
METRIC RANK
4.3%
UNEMPLOYMENT AMONG AGES 45 TO 54 YEARS
99.3/ 100
METRIC RATING
56th/ 347
METRIC RANK

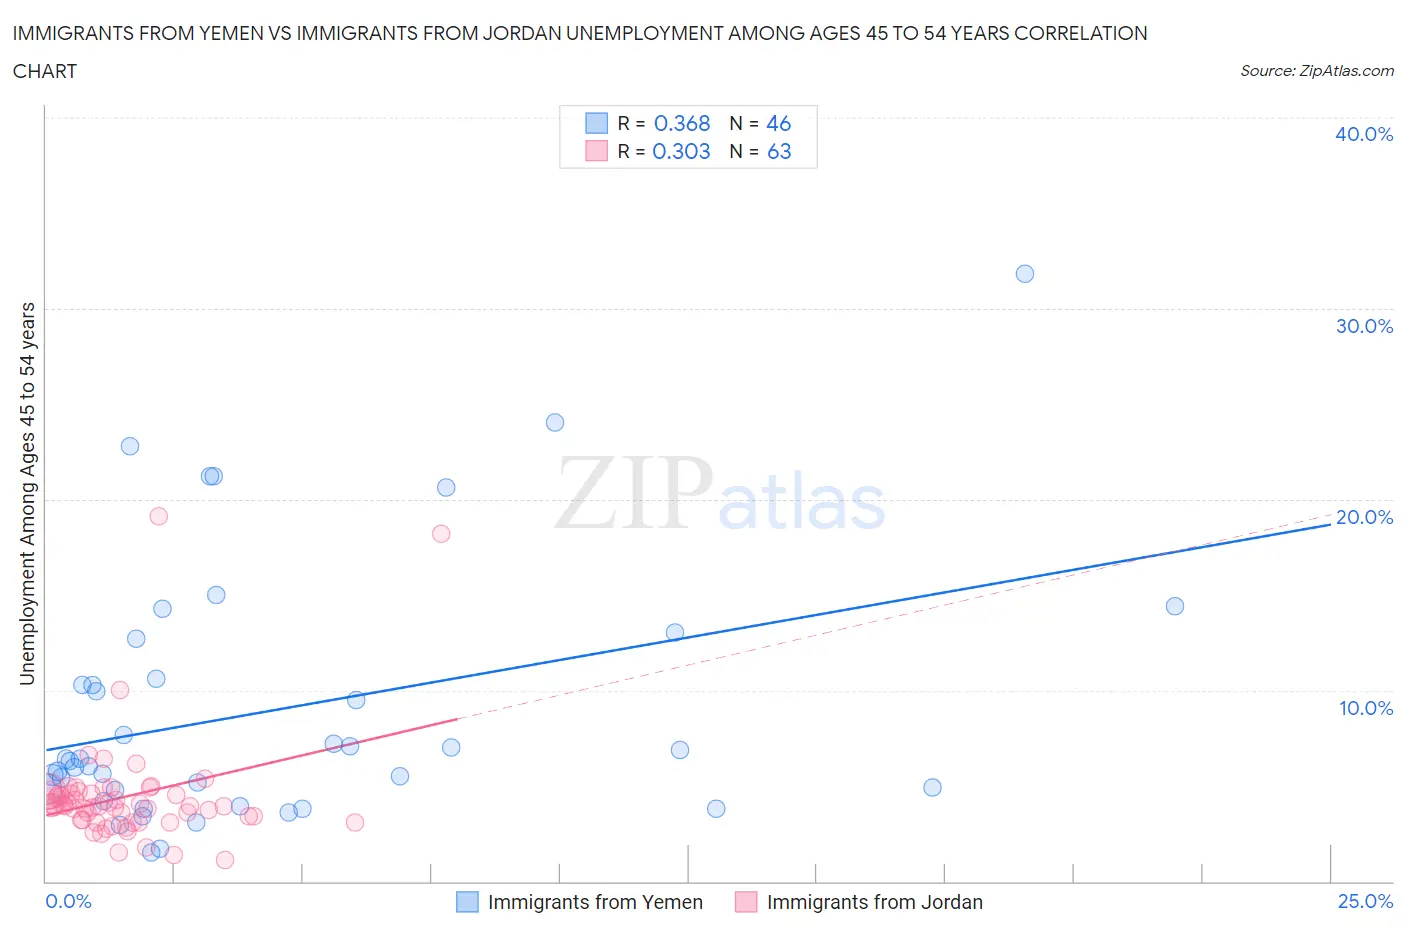
Immigrants from Yemen vs Immigrants from Jordan Unemployment Among Ages 45 to 54 years Correlation Chart

The statistical analysis conducted on geographies consisting of 82,096,042 people shows a mild positive correlation between the proportion of Immigrants from Yemen and unemployment rate among population between the ages 45 and 54 in the United States with a correlation coefficient (R) of 0.368 and weighted average of 6.5%. Similarly, the statistical analysis conducted on geographies consisting of 179,872,671 people shows a mild positive correlation between the proportion of Immigrants from Jordan and unemployment rate among population between the ages 45 and 54 in the United States with a correlation coefficient (R) of 0.303 and weighted average of 4.3%, a difference of 53.9%.
Immigrants from Yemen vs Immigrants from Jordan Unemployment Among Ages 45 to 54 years

Unemployment Among Ages 45 to 54 years Correlation Summary

MeasurementImmigrants from YemenImmigrants from Jordan
Minimum1.5%1.1%
Maximum31.8%19.1%
Range30.3%18.0%
Mean9.0%4.4%
Median6.3%4.0%
Interquartile 25% (IQ1)4.8%3.2%
Interquartile 75% (IQ3)10.6%4.6%
Interquartile Range (IQR)5.8%1.4%
Standard Deviation (Sample)6.7%2.9%
Standard Deviation (Population)6.7%2.9%

Similar Demographics by Unemployment Among Ages 45 to 54 years

Demographics Similar to Immigrants from Yemen by Unemployment Among Ages 45 to 54 years

In terms of unemployment among ages 45 to 54 years, the demographic groups most similar to Immigrants from Yemen are Sioux (6.6%, a difference of 1.1%), Navajo (6.7%, a difference of 1.5%), Pima (6.4%, a difference of 1.7%), Puerto Rican (6.8%, a difference of 3.8%), and Tohono O'odham (6.3%, a difference of 4.5%).
DemographicsRating | RankUnemployment Among Ages 45 to 54 years
Ute
0.0
/100
|
#326
Tragic
6.2%
Dominicans
0.0
/100
|
#327
Tragic
6.2%
Pueblo
0.0
/100
|
#328
Tragic
6.2%
Alaska Natives
0.0
/100
|
#329
Tragic
6.3%
Immigrants | Dominican Republic
0.0
/100
|
#330
Tragic
6.3%
Tohono O'odham
0.0
/100
|
#331
Tragic
6.3%
Pima
0.0
/100
|
#332
Tragic
6.4%
Immigrants | Yemen
0.0
/100
|
#333
Tragic
6.5%
Sioux
0.0
/100
|
#334
Tragic
6.6%
Navajo
0.0
/100
|
#335
Tragic
6.7%
Puerto Ricans
0.0
/100
|
#336
Tragic
6.8%
Apache
0.0
/100
|
#337
Tragic
7.0%
Colville
0.0
/100
|
#338
Tragic
7.4%
Arapaho
0.0
/100
|
#339
Tragic
7.5%
Hopi
0.0
/100
|
#340
Tragic
7.5%

Demographics Similar to Immigrants from Jordan by Unemployment Among Ages 45 to 54 years

In terms of unemployment among ages 45 to 54 years, the demographic groups most similar to Immigrants from Jordan are Immigrants from Sri Lanka (4.3%, a difference of 0.060%), Greek (4.3%, a difference of 0.11%), Latvian (4.2%, a difference of 0.16%), Okinawan (4.3%, a difference of 0.18%), and Immigrants from Korea (4.3%, a difference of 0.22%).
DemographicsRating | RankUnemployment Among Ages 45 to 54 years
Immigrants | Zimbabwe
99.6
/100
|
#49
Exceptional
4.2%
Basques
99.6
/100
|
#50
Exceptional
4.2%
Burmese
99.6
/100
|
#51
Exceptional
4.2%
Poles
99.5
/100
|
#52
Exceptional
4.2%
Irish
99.5
/100
|
#53
Exceptional
4.2%
Chickasaw
99.5
/100
|
#54
Exceptional
4.2%
Latvians
99.4
/100
|
#55
Exceptional
4.2%
Immigrants | Jordan
99.3
/100
|
#56
Exceptional
4.3%
Immigrants | Sri Lanka
99.3
/100
|
#57
Exceptional
4.3%
Greeks
99.3
/100
|
#58
Exceptional
4.3%
Okinawans
99.2
/100
|
#59
Exceptional
4.3%
Immigrants | Korea
99.2
/100
|
#60
Exceptional
4.3%
Immigrants | Pakistan
99.2
/100
|
#61
Exceptional
4.3%
Lithuanians
99.1
/100
|
#62
Exceptional
4.3%
Pennsylvania Germans
99.1
/100
|
#63
Exceptional
4.3%