Salvadoran vs Colville Male Unemployment
COMPARE
Salvadoran
Colville
Male Unemployment
Male Unemployment Comparison
Salvadorans
Colville
5.7%
MALE UNEMPLOYMENT
1.0/ 100
METRIC RATING
241st/ 347
METRIC RANK
7.4%
MALE UNEMPLOYMENT
0.0/ 100
METRIC RATING
320th/ 347
METRIC RANK
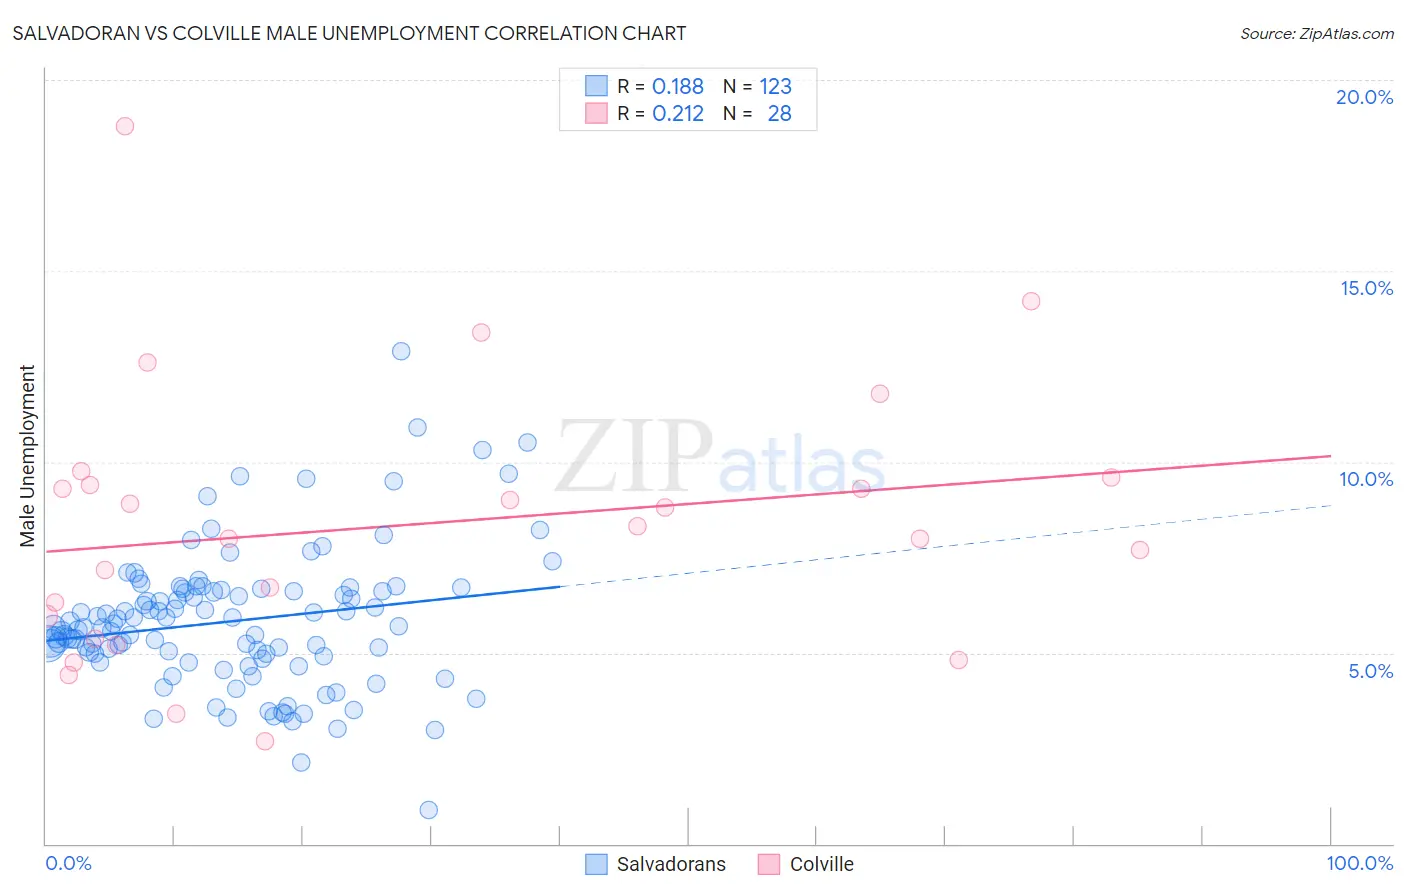
Salvadoran vs Colville Male Unemployment Correlation Chart
The statistical analysis conducted on geographies consisting of 397,423,657 people shows a poor positive correlation between the proportion of Salvadorans and unemployment rate among males in the United States with a correlation coefficient (R) of 0.188 and weighted average of 5.7%. Similarly, the statistical analysis conducted on geographies consisting of 34,671,392 people shows a weak positive correlation between the proportion of Colville and unemployment rate among males in the United States with a correlation coefficient (R) of 0.212 and weighted average of 7.4%, a difference of 30.4%.
Male Unemployment Correlation Summary
| Measurement | Salvadoran | Colville |
| Minimum | 0.90% | 2.7% |
| Maximum | 12.9% | 18.8% |
| Range | 12.0% | 16.1% |
| Mean | 5.8% | 8.3% |
| Median | 5.7% | 8.2% |
| Interquartile 25% (IQ1) | 4.9% | 5.7% |
| Interquartile 75% (IQ3) | 6.6% | 9.5% |
| Interquartile Range (IQR) | 1.7% | 3.8% |
| Standard Deviation (Sample) | 1.8% | 3.5% |
| Standard Deviation (Population) | 1.8% | 3.5% |
Similar Demographics by Male Unemployment
Demographics Similar to Salvadorans by Male Unemployment
In terms of male unemployment, the demographic groups most similar to Salvadorans are Immigrants from Cameroon (5.6%, a difference of 0.040%), Ottawa (5.7%, a difference of 0.070%), Immigrants from Guatemala (5.6%, a difference of 0.11%), Native Hawaiian (5.6%, a difference of 0.12%), and Honduran (5.6%, a difference of 0.16%).
| Demographics | Rating | Rank | Male Unemployment |
| Immigrants | Somalia | 1.5 /100 | #234 | Tragic 5.6% |
| Immigrants | Honduras | 1.5 /100 | #235 | Tragic 5.6% |
| Guatemalans | 1.2 /100 | #236 | Tragic 5.6% |
| Hondurans | 1.1 /100 | #237 | Tragic 5.6% |
| Native Hawaiians | 1.1 /100 | #238 | Tragic 5.6% |
| Immigrants | Guatemala | 1.1 /100 | #239 | Tragic 5.6% |
| Immigrants | Cameroon | 1.0 /100 | #240 | Tragic 5.6% |
| Salvadorans | 1.0 /100 | #241 | Tragic 5.7% |
| Ottawa | 0.9 /100 | #242 | Tragic 5.7% |
| Bangladeshis | 0.8 /100 | #243 | Tragic 5.7% |
| Immigrants | El Salvador | 0.7 /100 | #244 | Tragic 5.7% |
| Yaqui | 0.7 /100 | #245 | Tragic 5.7% |
| Iroquois | 0.6 /100 | #246 | Tragic 5.7% |
| Hawaiians | 0.6 /100 | #247 | Tragic 5.7% |
| Marshallese | 0.5 /100 | #248 | Tragic 5.7% |
Demographics Similar to Colville by Male Unemployment
In terms of male unemployment, the demographic groups most similar to Colville are British West Indian (7.3%, a difference of 0.90%), Immigrants from St. Vincent and the Grenadines (7.5%, a difference of 1.4%), Immigrants from Cabo Verde (7.5%, a difference of 1.7%), Immigrants from Grenada (7.6%, a difference of 2.5%), and Dominican (7.6%, a difference of 2.8%).
| Demographics | Rating | Rank | Male Unemployment |
| Immigrants | Dominica | 0.0 /100 | #313 | Tragic 7.0% |
| Immigrants | Barbados | 0.0 /100 | #314 | Tragic 7.1% |
| Houma | 0.0 /100 | #315 | Tragic 7.1% |
| Immigrants | Guyana | 0.0 /100 | #316 | Tragic 7.1% |
| Guyanese | 0.0 /100 | #317 | Tragic 7.1% |
| Cape Verdeans | 0.0 /100 | #318 | Tragic 7.1% |
| British West Indians | 0.0 /100 | #319 | Tragic 7.3% |
| Colville | 0.0 /100 | #320 | Tragic 7.4% |
| Immigrants | St. Vincent and the Grenadines | 0.0 /100 | #321 | Tragic 7.5% |
| Immigrants | Cabo Verde | 0.0 /100 | #322 | Tragic 7.5% |
| Immigrants | Grenada | 0.0 /100 | #323 | Tragic 7.6% |
| Dominicans | 0.0 /100 | #324 | Tragic 7.6% |
| Shoshone | 0.0 /100 | #325 | Tragic 7.6% |
| Immigrants | Dominican Republic | 0.0 /100 | #326 | Tragic 7.6% |
| Paiute | 0.0 /100 | #327 | Tragic 7.7% |