Japanese vs Colville Male Unemployment
COMPARE
Japanese
Colville
Male Unemployment
Male Unemployment Comparison
Japanese
Colville
5.8%
MALE UNEMPLOYMENT
0.2/ 100
METRIC RATING
254th/ 347
METRIC RANK
7.4%
MALE UNEMPLOYMENT
0.0/ 100
METRIC RATING
320th/ 347
METRIC RANK
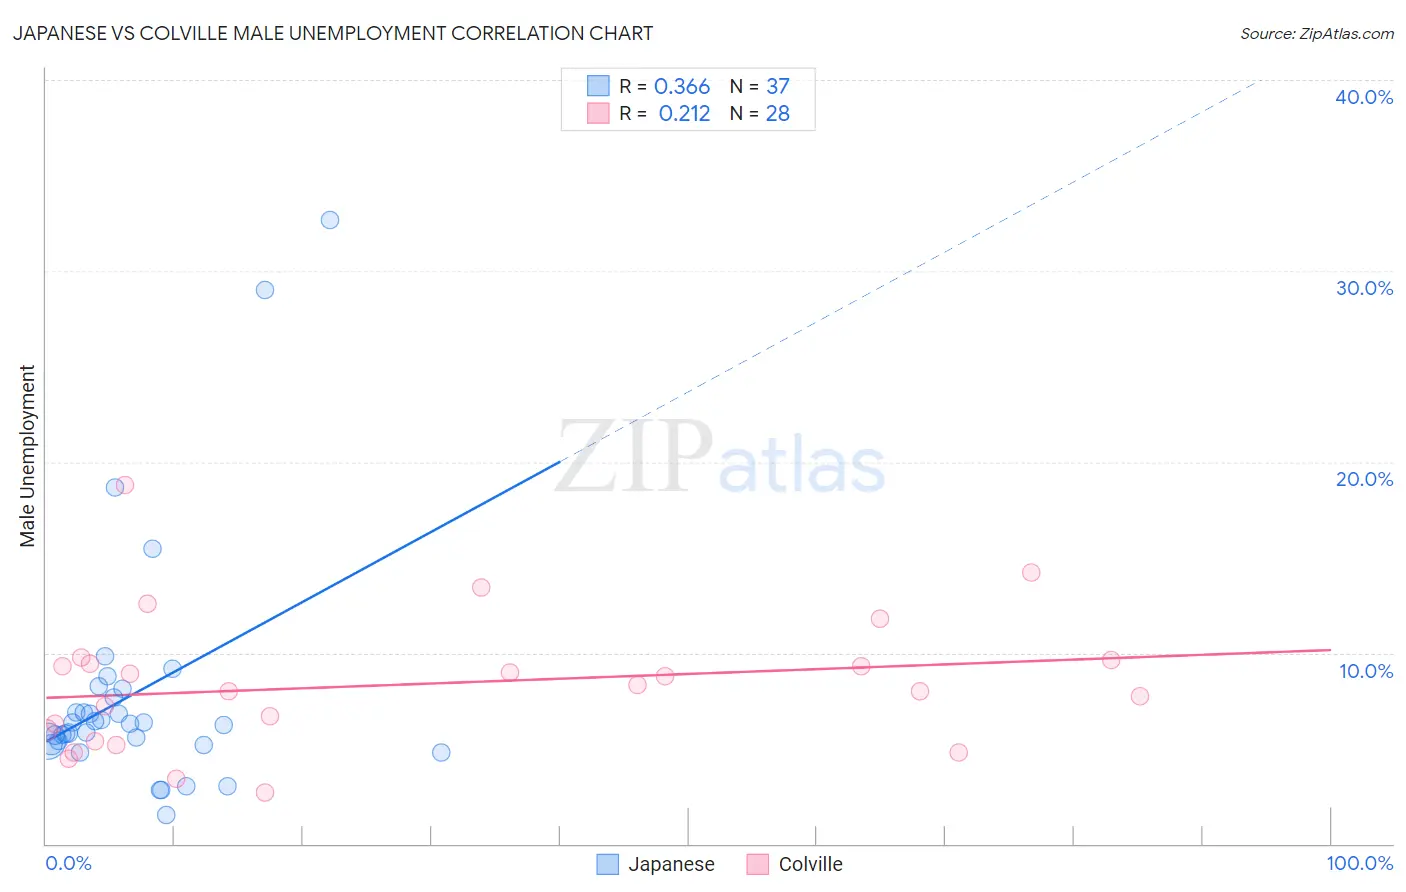
Japanese vs Colville Male Unemployment Correlation Chart
The statistical analysis conducted on geographies consisting of 248,784,678 people shows a mild positive correlation between the proportion of Japanese and unemployment rate among males in the United States with a correlation coefficient (R) of 0.366 and weighted average of 5.8%. Similarly, the statistical analysis conducted on geographies consisting of 34,671,392 people shows a weak positive correlation between the proportion of Colville and unemployment rate among males in the United States with a correlation coefficient (R) of 0.212 and weighted average of 7.4%, a difference of 27.4%.
Male Unemployment Correlation Summary
| Measurement | Japanese | Colville |
| Minimum | 1.5% | 2.7% |
| Maximum | 32.7% | 18.8% |
| Range | 31.2% | 16.1% |
| Mean | 7.9% | 8.3% |
| Median | 6.3% | 8.2% |
| Interquartile 25% (IQ1) | 5.3% | 5.7% |
| Interquartile 75% (IQ3) | 7.9% | 9.5% |
| Interquartile Range (IQR) | 2.6% | 3.8% |
| Standard Deviation (Sample) | 6.4% | 3.5% |
| Standard Deviation (Population) | 6.3% | 3.5% |
Similar Demographics by Male Unemployment
Demographics Similar to Japanese by Male Unemployment
In terms of male unemployment, the demographic groups most similar to Japanese are Kiowa (5.8%, a difference of 0.10%), Mexican American Indian (5.8%, a difference of 0.17%), Comanche (5.8%, a difference of 0.18%), Mexican (5.8%, a difference of 0.30%), and Hispanic or Latino (5.8%, a difference of 0.35%).
| Demographics | Rating | Rank | Male Unemployment |
| Hawaiians | 0.6 /100 | #247 | Tragic 5.7% |
| Marshallese | 0.5 /100 | #248 | Tragic 5.7% |
| Cree | 0.4 /100 | #249 | Tragic 5.7% |
| Immigrants | Bahamas | 0.4 /100 | #250 | Tragic 5.7% |
| Spanish Americans | 0.3 /100 | #251 | Tragic 5.7% |
| Mexicans | 0.2 /100 | #252 | Tragic 5.8% |
| Mexican American Indians | 0.2 /100 | #253 | Tragic 5.8% |
| Japanese | 0.2 /100 | #254 | Tragic 5.8% |
| Kiowa | 0.2 /100 | #255 | Tragic 5.8% |
| Comanche | 0.2 /100 | #256 | Tragic 5.8% |
| Hispanics or Latinos | 0.1 /100 | #257 | Tragic 5.8% |
| Dutch West Indians | 0.1 /100 | #258 | Tragic 5.8% |
| Cajuns | 0.1 /100 | #259 | Tragic 5.8% |
| Immigrants | Central America | 0.1 /100 | #260 | Tragic 5.8% |
| Liberians | 0.1 /100 | #261 | Tragic 5.8% |
Demographics Similar to Colville by Male Unemployment
In terms of male unemployment, the demographic groups most similar to Colville are British West Indian (7.3%, a difference of 0.90%), Immigrants from St. Vincent and the Grenadines (7.5%, a difference of 1.4%), Immigrants from Cabo Verde (7.5%, a difference of 1.7%), Immigrants from Grenada (7.6%, a difference of 2.5%), and Dominican (7.6%, a difference of 2.8%).
| Demographics | Rating | Rank | Male Unemployment |
| Immigrants | Dominica | 0.0 /100 | #313 | Tragic 7.0% |
| Immigrants | Barbados | 0.0 /100 | #314 | Tragic 7.1% |
| Houma | 0.0 /100 | #315 | Tragic 7.1% |
| Immigrants | Guyana | 0.0 /100 | #316 | Tragic 7.1% |
| Guyanese | 0.0 /100 | #317 | Tragic 7.1% |
| Cape Verdeans | 0.0 /100 | #318 | Tragic 7.1% |
| British West Indians | 0.0 /100 | #319 | Tragic 7.3% |
| Colville | 0.0 /100 | #320 | Tragic 7.4% |
| Immigrants | St. Vincent and the Grenadines | 0.0 /100 | #321 | Tragic 7.5% |
| Immigrants | Cabo Verde | 0.0 /100 | #322 | Tragic 7.5% |
| Immigrants | Grenada | 0.0 /100 | #323 | Tragic 7.6% |
| Dominicans | 0.0 /100 | #324 | Tragic 7.6% |
| Shoshone | 0.0 /100 | #325 | Tragic 7.6% |
| Immigrants | Dominican Republic | 0.0 /100 | #326 | Tragic 7.6% |
| Paiute | 0.0 /100 | #327 | Tragic 7.7% |