Salvadoran vs Menominee Male Unemployment
COMPARE
Salvadoran
Menominee
Male Unemployment
Male Unemployment Comparison
Salvadorans
Menominee
5.7%
MALE UNEMPLOYMENT
1.0/ 100
METRIC RATING
241st/ 347
METRIC RANK
6.0%
MALE UNEMPLOYMENT
0.0/ 100
METRIC RATING
275th/ 347
METRIC RANK
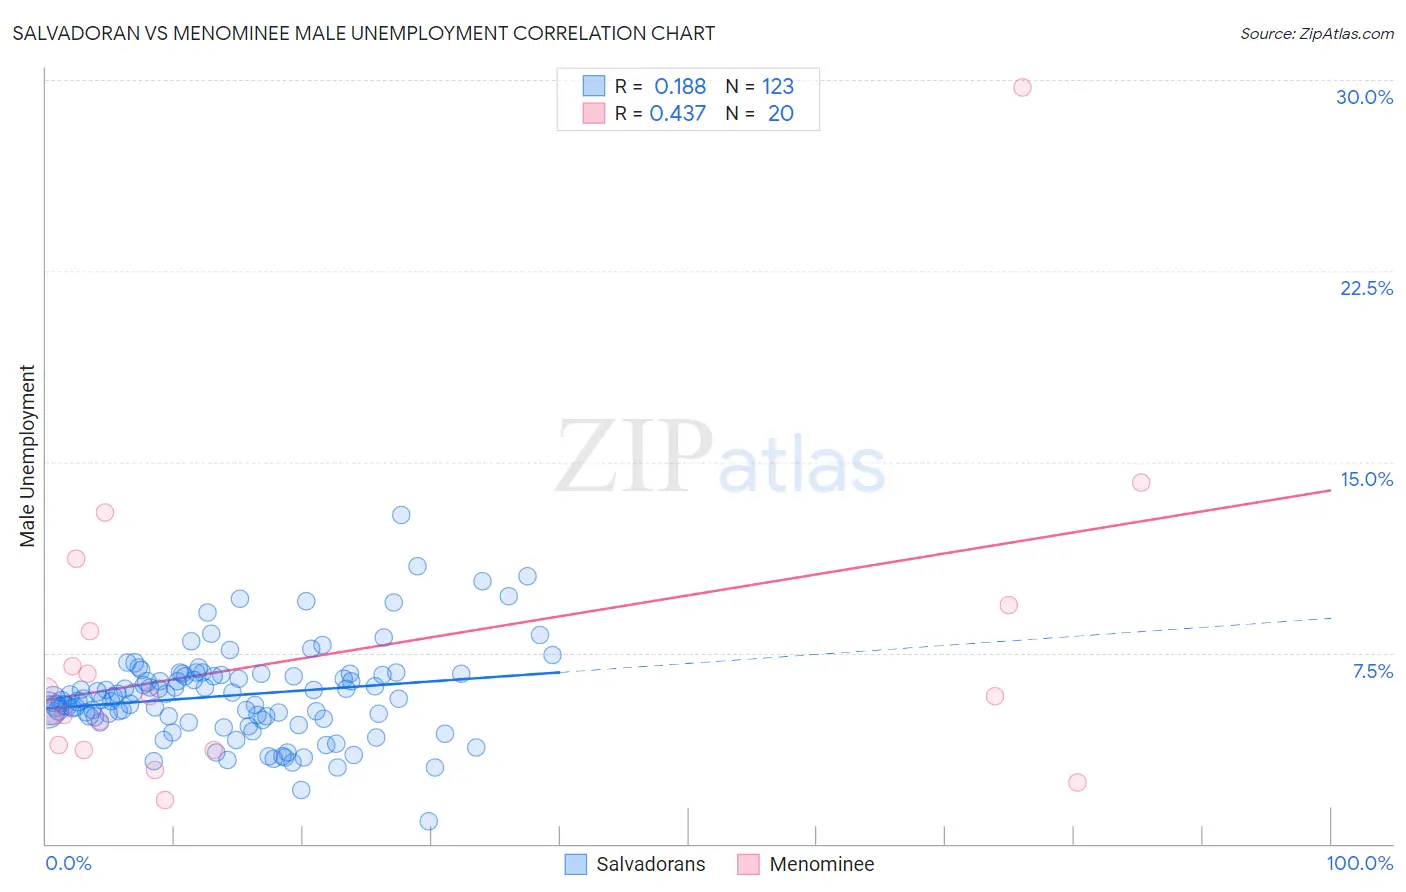
Salvadoran vs Menominee Male Unemployment Correlation Chart
The statistical analysis conducted on geographies consisting of 397,423,657 people shows a poor positive correlation between the proportion of Salvadorans and unemployment rate among males in the United States with a correlation coefficient (R) of 0.188 and weighted average of 5.7%. Similarly, the statistical analysis conducted on geographies consisting of 45,696,214 people shows a moderate positive correlation between the proportion of Menominee and unemployment rate among males in the United States with a correlation coefficient (R) of 0.437 and weighted average of 6.0%, a difference of 6.6%.
Male Unemployment Correlation Summary
| Measurement | Salvadoran | Menominee |
| Minimum | 0.90% | 1.7% |
| Maximum | 12.9% | 29.7% |
| Range | 12.0% | 28.0% |
| Mean | 5.8% | 7.5% |
| Median | 5.7% | 5.8% |
| Interquartile 25% (IQ1) | 4.9% | 3.8% |
| Interquartile 75% (IQ3) | 6.6% | 8.9% |
| Interquartile Range (IQR) | 1.7% | 5.1% |
| Standard Deviation (Sample) | 1.8% | 6.2% |
| Standard Deviation (Population) | 1.8% | 6.1% |
Similar Demographics by Male Unemployment
Demographics Similar to Salvadorans by Male Unemployment
In terms of male unemployment, the demographic groups most similar to Salvadorans are Immigrants from Cameroon (5.6%, a difference of 0.040%), Ottawa (5.7%, a difference of 0.070%), Immigrants from Guatemala (5.6%, a difference of 0.11%), Native Hawaiian (5.6%, a difference of 0.12%), and Honduran (5.6%, a difference of 0.16%).
| Demographics | Rating | Rank | Male Unemployment |
| Immigrants | Somalia | 1.5 /100 | #234 | Tragic 5.6% |
| Immigrants | Honduras | 1.5 /100 | #235 | Tragic 5.6% |
| Guatemalans | 1.2 /100 | #236 | Tragic 5.6% |
| Hondurans | 1.1 /100 | #237 | Tragic 5.6% |
| Native Hawaiians | 1.1 /100 | #238 | Tragic 5.6% |
| Immigrants | Guatemala | 1.1 /100 | #239 | Tragic 5.6% |
| Immigrants | Cameroon | 1.0 /100 | #240 | Tragic 5.6% |
| Salvadorans | 1.0 /100 | #241 | Tragic 5.7% |
| Ottawa | 0.9 /100 | #242 | Tragic 5.7% |
| Bangladeshis | 0.8 /100 | #243 | Tragic 5.7% |
| Immigrants | El Salvador | 0.7 /100 | #244 | Tragic 5.7% |
| Yaqui | 0.7 /100 | #245 | Tragic 5.7% |
| Iroquois | 0.6 /100 | #246 | Tragic 5.7% |
| Hawaiians | 0.6 /100 | #247 | Tragic 5.7% |
| Marshallese | 0.5 /100 | #248 | Tragic 5.7% |
Demographics Similar to Menominee by Male Unemployment
In terms of male unemployment, the demographic groups most similar to Menominee are Tlingit-Haida (6.0%, a difference of 0.10%), Immigrants from Sierra Leone (6.0%, a difference of 0.15%), Armenian (6.0%, a difference of 0.33%), Immigrants from Uzbekistan (6.0%, a difference of 0.34%), and Immigrants from Liberia (6.1%, a difference of 0.52%).
| Demographics | Rating | Rank | Male Unemployment |
| Bermudans | 0.0 /100 | #268 | Tragic 5.9% |
| Immigrants | Nigeria | 0.0 /100 | #269 | Tragic 6.0% |
| Sub-Saharan Africans | 0.0 /100 | #270 | Tragic 6.0% |
| Blackfeet | 0.0 /100 | #271 | Tragic 6.0% |
| Immigrants | Uzbekistan | 0.0 /100 | #272 | Tragic 6.0% |
| Armenians | 0.0 /100 | #273 | Tragic 6.0% |
| Immigrants | Sierra Leone | 0.0 /100 | #274 | Tragic 6.0% |
| Menominee | 0.0 /100 | #275 | Tragic 6.0% |
| Tlingit-Haida | 0.0 /100 | #276 | Tragic 6.0% |
| Immigrants | Liberia | 0.0 /100 | #277 | Tragic 6.1% |
| Immigrants | Fiji | 0.0 /100 | #278 | Tragic 6.1% |
| Ghanaians | 0.0 /100 | #279 | Tragic 6.1% |
| Immigrants | Ghana | 0.0 /100 | #280 | Tragic 6.2% |
| Sierra Leoneans | 0.0 /100 | #281 | Tragic 6.2% |
| Ecuadorians | 0.0 /100 | #282 | Tragic 6.2% |