Russian vs Yup'ik Unemployment Among Ages 30 to 34 years
COMPARE
Russian
Yup'ik
Unemployment Among Ages 30 to 34 years
Unemployment Among Ages 30 to 34 years Comparison
Russians
Yup'ik
5.4%
UNEMPLOYMENT AMONG AGES 30 TO 34 YEARS
71.1/ 100
METRIC RATING
143rd/ 347
METRIC RANK
18.5%
UNEMPLOYMENT AMONG AGES 30 TO 34 YEARS
0.0/ 100
METRIC RATING
347th/ 347
METRIC RANK
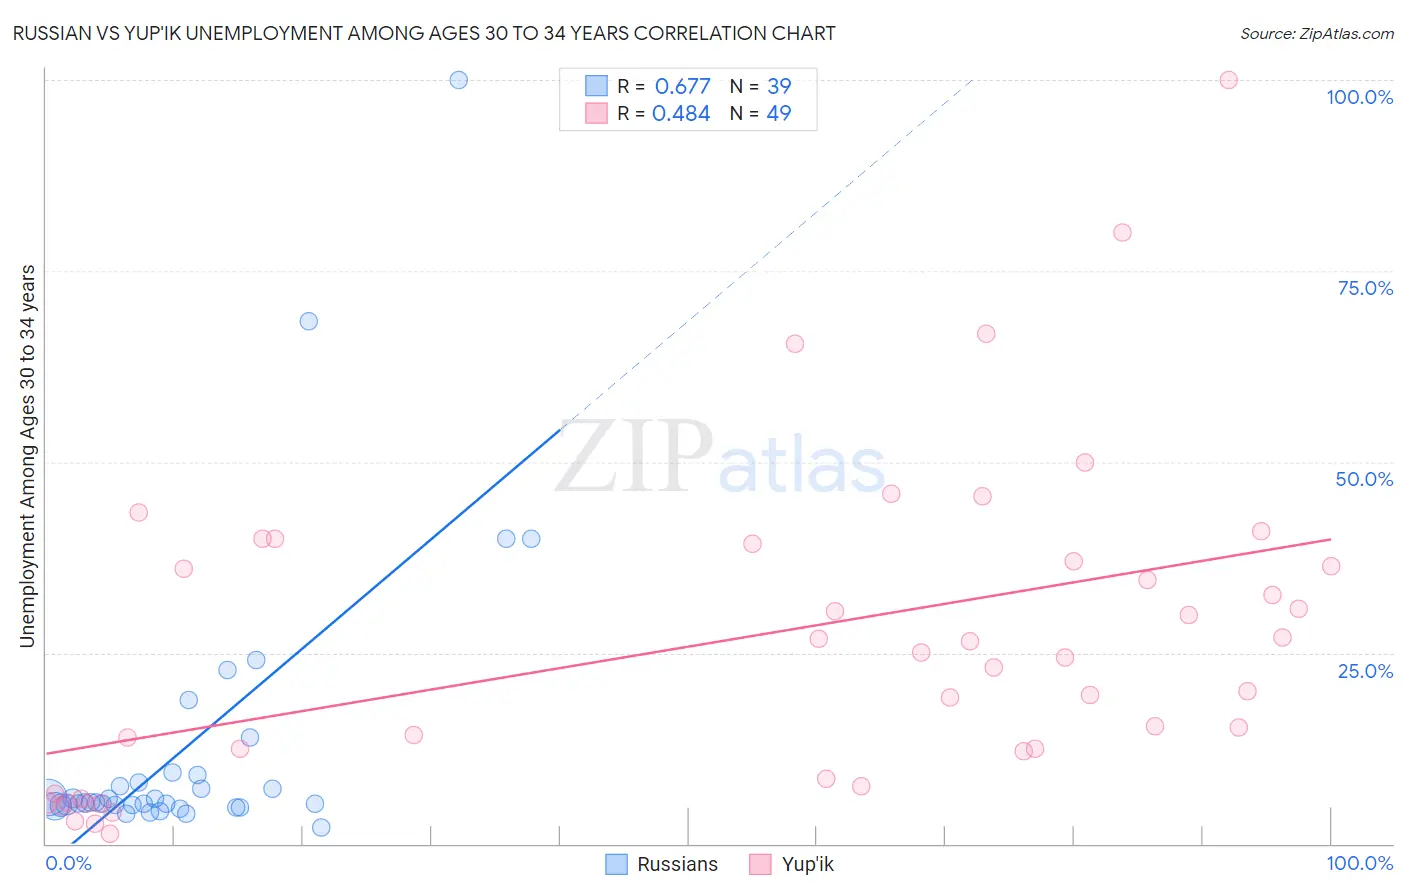
Russian vs Yup'ik Unemployment Among Ages 30 to 34 years Correlation Chart
The statistical analysis conducted on geographies consisting of 461,775,023 people shows a significant positive correlation between the proportion of Russians and unemployment rate among population between the ages 30 and 34 in the United States with a correlation coefficient (R) of 0.677 and weighted average of 5.4%. Similarly, the statistical analysis conducted on geographies consisting of 39,304,366 people shows a moderate positive correlation between the proportion of Yup'ik and unemployment rate among population between the ages 30 and 34 in the United States with a correlation coefficient (R) of 0.484 and weighted average of 18.5%, a difference of 243.6%.
Unemployment Among Ages 30 to 34 years Correlation Summary
| Measurement | Russian | Yup'ik |
| Minimum | 2.2% | 1.3% |
| Maximum | 100.0% | 100.0% |
| Range | 97.8% | 98.7% |
| Mean | 12.8% | 26.5% |
| Median | 5.3% | 24.5% |
| Interquartile 25% (IQ1) | 5.0% | 8.1% |
| Interquartile 75% (IQ3) | 8.9% | 38.1% |
| Interquartile Range (IQR) | 3.9% | 30.1% |
| Standard Deviation (Sample) | 19.3% | 21.2% |
| Standard Deviation (Population) | 19.0% | 20.9% |
Similar Demographics by Unemployment Among Ages 30 to 34 years
Demographics Similar to Russians by Unemployment Among Ages 30 to 34 years
In terms of unemployment among ages 30 to 34 years, the demographic groups most similar to Russians are Immigrants from Russia (5.4%, a difference of 0.020%), Immigrants from Europe (5.4%, a difference of 0.080%), Immigrants from Greece (5.4%, a difference of 0.080%), Syrian (5.4%, a difference of 0.080%), and Celtic (5.4%, a difference of 0.080%).
| Demographics | Rating | Rank | Unemployment Among Ages 30 to 34 years |
| Pakistanis | 74.6 /100 | #136 | Good 5.4% |
| Immigrants | Canada | 74.6 /100 | #137 | Good 5.4% |
| Serbians | 72.9 /100 | #138 | Good 5.4% |
| Lithuanians | 72.4 /100 | #139 | Good 5.4% |
| Immigrants | North America | 72.2 /100 | #140 | Good 5.4% |
| Immigrants | Europe | 72.1 /100 | #141 | Good 5.4% |
| Immigrants | Greece | 72.0 /100 | #142 | Good 5.4% |
| Russians | 71.1 /100 | #143 | Good 5.4% |
| Immigrants | Russia | 71.0 /100 | #144 | Good 5.4% |
| Syrians | 70.3 /100 | #145 | Good 5.4% |
| Celtics | 70.2 /100 | #146 | Good 5.4% |
| Ukrainians | 69.2 /100 | #147 | Good 5.4% |
| Immigrants | Iran | 69.1 /100 | #148 | Good 5.4% |
| Immigrants | Colombia | 68.9 /100 | #149 | Good 5.4% |
| Colombians | 68.7 /100 | #150 | Good 5.4% |
Demographics Similar to Yup'ik by Unemployment Among Ages 30 to 34 years
In terms of unemployment among ages 30 to 34 years, the demographic groups most similar to Yup'ik are Tsimshian (13.8%, a difference of 34.2%), Arapaho (12.8%, a difference of 44.1%), Hopi (11.9%, a difference of 54.7%), Inupiat (10.8%, a difference of 70.7%), and Yuman (10.6%, a difference of 74.3%).
| Demographics | Rating | Rank | Unemployment Among Ages 30 to 34 years |
| Pueblo | 0.0 /100 | #333 | Tragic 8.3% |
| Alaska Natives | 0.0 /100 | #334 | Tragic 8.5% |
| Puerto Ricans | 0.0 /100 | #335 | Tragic 8.9% |
| Colville | 0.0 /100 | #336 | Tragic 9.0% |
| Pima | 0.0 /100 | #337 | Tragic 9.6% |
| Yakama | 0.0 /100 | #338 | Tragic 9.8% |
| Tohono O'odham | 0.0 /100 | #339 | Tragic 9.8% |
| Crow | 0.0 /100 | #340 | Tragic 10.3% |
| Navajo | 0.0 /100 | #341 | Tragic 10.6% |
| Yuman | 0.0 /100 | #342 | Tragic 10.6% |
| Inupiat | 0.0 /100 | #343 | Tragic 10.8% |
| Hopi | 0.0 /100 | #344 | Tragic 11.9% |
| Arapaho | 0.0 /100 | #345 | Tragic 12.8% |
| Tsimshian | 0.0 /100 | #346 | Tragic 13.8% |
| Yup'ik | 0.0 /100 | #347 | Tragic 18.5% |