Russian vs Alaskan Athabascan Unemployment Among Ages 30 to 34 years
COMPARE
Russian
Alaskan Athabascan
Unemployment Among Ages 30 to 34 years
Unemployment Among Ages 30 to 34 years Comparison
Russians
Alaskan Athabascans
5.4%
UNEMPLOYMENT AMONG AGES 30 TO 34 YEARS
71.1/ 100
METRIC RATING
143rd/ 347
METRIC RANK
7.0%
UNEMPLOYMENT AMONG AGES 30 TO 34 YEARS
0.0/ 100
METRIC RATING
311th/ 347
METRIC RANK
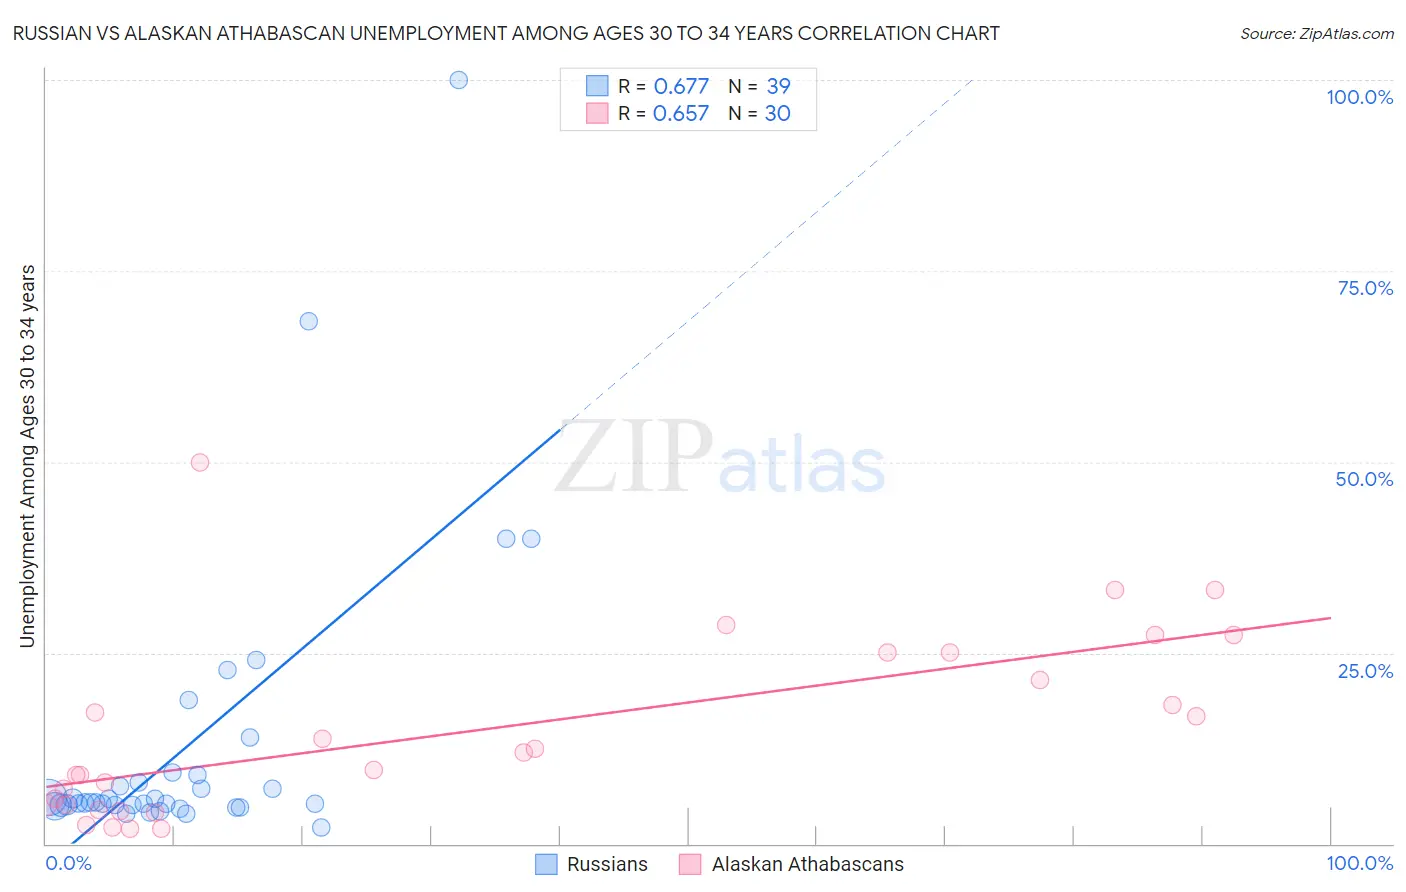
Russian vs Alaskan Athabascan Unemployment Among Ages 30 to 34 years Correlation Chart
The statistical analysis conducted on geographies consisting of 461,775,023 people shows a significant positive correlation between the proportion of Russians and unemployment rate among population between the ages 30 and 34 in the United States with a correlation coefficient (R) of 0.677 and weighted average of 5.4%. Similarly, the statistical analysis conducted on geographies consisting of 45,103,886 people shows a significant positive correlation between the proportion of Alaskan Athabascans and unemployment rate among population between the ages 30 and 34 in the United States with a correlation coefficient (R) of 0.657 and weighted average of 7.0%, a difference of 30.9%.
Unemployment Among Ages 30 to 34 years Correlation Summary
| Measurement | Russian | Alaskan Athabascan |
| Minimum | 2.2% | 1.9% |
| Maximum | 100.0% | 50.0% |
| Range | 97.8% | 48.1% |
| Mean | 12.8% | 14.7% |
| Median | 5.3% | 10.8% |
| Interquartile 25% (IQ1) | 5.0% | 5.0% |
| Interquartile 75% (IQ3) | 8.9% | 25.0% |
| Interquartile Range (IQR) | 3.9% | 20.0% |
| Standard Deviation (Sample) | 19.3% | 12.0% |
| Standard Deviation (Population) | 19.0% | 11.8% |
Similar Demographics by Unemployment Among Ages 30 to 34 years
Demographics Similar to Russians by Unemployment Among Ages 30 to 34 years
In terms of unemployment among ages 30 to 34 years, the demographic groups most similar to Russians are Immigrants from Russia (5.4%, a difference of 0.020%), Immigrants from Europe (5.4%, a difference of 0.080%), Immigrants from Greece (5.4%, a difference of 0.080%), Syrian (5.4%, a difference of 0.080%), and Celtic (5.4%, a difference of 0.080%).
| Demographics | Rating | Rank | Unemployment Among Ages 30 to 34 years |
| Pakistanis | 74.6 /100 | #136 | Good 5.4% |
| Immigrants | Canada | 74.6 /100 | #137 | Good 5.4% |
| Serbians | 72.9 /100 | #138 | Good 5.4% |
| Lithuanians | 72.4 /100 | #139 | Good 5.4% |
| Immigrants | North America | 72.2 /100 | #140 | Good 5.4% |
| Immigrants | Europe | 72.1 /100 | #141 | Good 5.4% |
| Immigrants | Greece | 72.0 /100 | #142 | Good 5.4% |
| Russians | 71.1 /100 | #143 | Good 5.4% |
| Immigrants | Russia | 71.0 /100 | #144 | Good 5.4% |
| Syrians | 70.3 /100 | #145 | Good 5.4% |
| Celtics | 70.2 /100 | #146 | Good 5.4% |
| Ukrainians | 69.2 /100 | #147 | Good 5.4% |
| Immigrants | Iran | 69.1 /100 | #148 | Good 5.4% |
| Immigrants | Colombia | 68.9 /100 | #149 | Good 5.4% |
| Colombians | 68.7 /100 | #150 | Good 5.4% |
Demographics Similar to Alaskan Athabascans by Unemployment Among Ages 30 to 34 years
In terms of unemployment among ages 30 to 34 years, the demographic groups most similar to Alaskan Athabascans are British West Indian (7.0%, a difference of 0.070%), Ute (7.0%, a difference of 0.12%), Lumbee (7.1%, a difference of 0.33%), Aleut (7.1%, a difference of 0.69%), and Immigrants from St. Vincent and the Grenadines (7.0%, a difference of 1.1%).
| Demographics | Rating | Rank | Unemployment Among Ages 30 to 34 years |
| Kiowa | 0.0 /100 | #304 | Tragic 6.7% |
| Paiute | 0.0 /100 | #305 | Tragic 6.7% |
| Immigrants | Armenia | 0.0 /100 | #306 | Tragic 6.8% |
| Immigrants | Belize | 0.0 /100 | #307 | Tragic 6.9% |
| Immigrants | Azores | 0.0 /100 | #308 | Tragic 6.9% |
| Immigrants | Grenada | 0.0 /100 | #309 | Tragic 6.9% |
| Immigrants | St. Vincent and the Grenadines | 0.0 /100 | #310 | Tragic 7.0% |
| Alaskan Athabascans | 0.0 /100 | #311 | Tragic 7.0% |
| British West Indians | 0.0 /100 | #312 | Tragic 7.0% |
| Ute | 0.0 /100 | #313 | Tragic 7.0% |
| Lumbee | 0.0 /100 | #314 | Tragic 7.1% |
| Aleuts | 0.0 /100 | #315 | Tragic 7.1% |
| Houma | 0.0 /100 | #316 | Tragic 7.2% |
| Immigrants | Cabo Verde | 0.0 /100 | #317 | Tragic 7.2% |
| Blacks/African Americans | 0.0 /100 | #318 | Tragic 7.2% |