Romanian vs Immigrants from Haiti Unemployment Among Ages 30 to 34 years
COMPARE
Romanian
Immigrants from Haiti
Unemployment Among Ages 30 to 34 years
Unemployment Among Ages 30 to 34 years Comparison
Romanians
Immigrants from Haiti
5.3%
UNEMPLOYMENT AMONG AGES 30 TO 34 YEARS
82.3/ 100
METRIC RATING
121st/ 347
METRIC RANK
6.2%
UNEMPLOYMENT AMONG AGES 30 TO 34 YEARS
0.0/ 100
METRIC RATING
268th/ 347
METRIC RANK
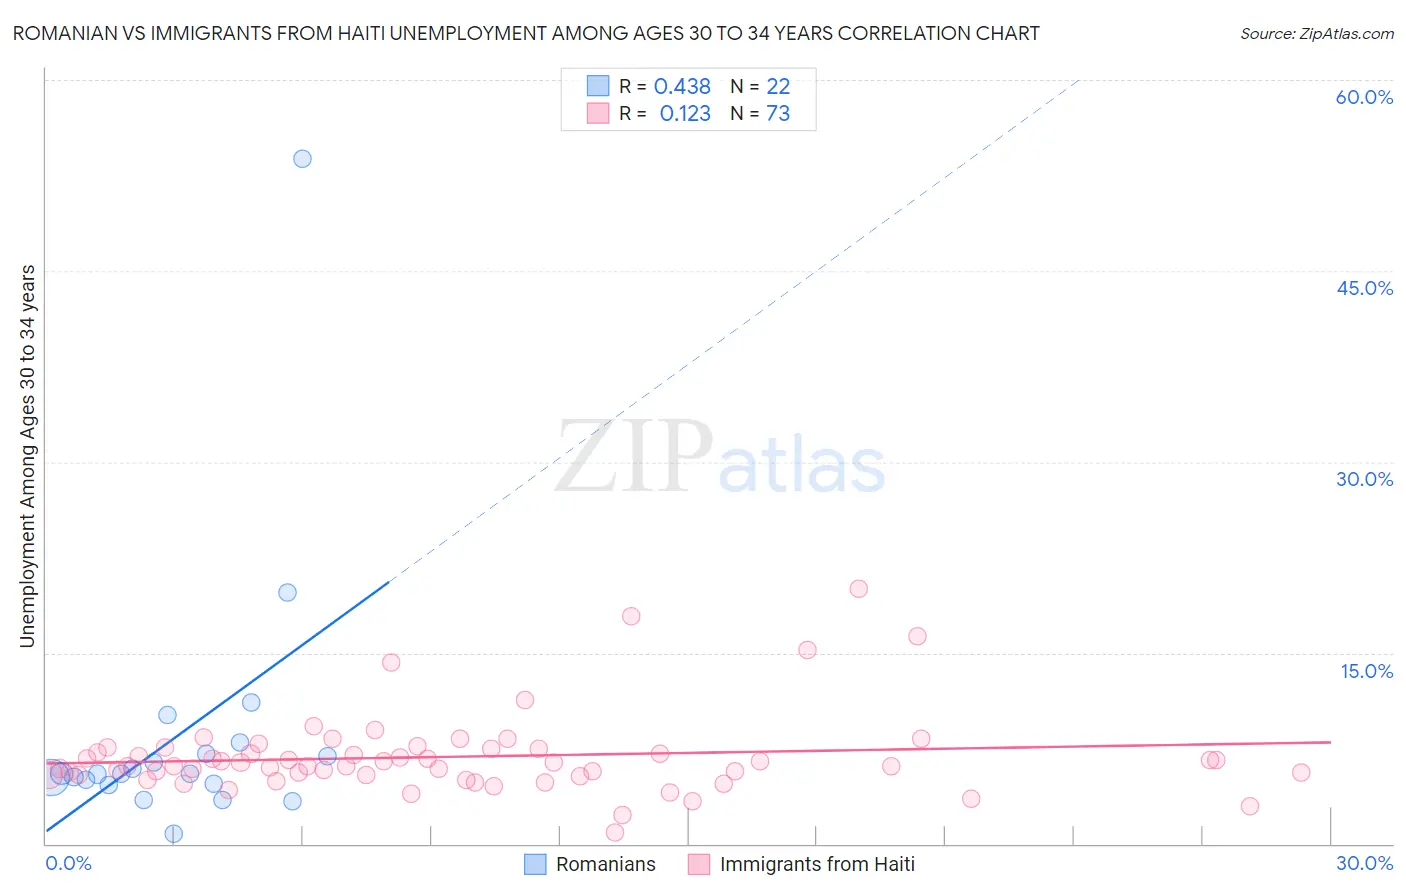
Romanian vs Immigrants from Haiti Unemployment Among Ages 30 to 34 years Correlation Chart
The statistical analysis conducted on geographies consisting of 355,508,215 people shows a moderate positive correlation between the proportion of Romanians and unemployment rate among population between the ages 30 and 34 in the United States with a correlation coefficient (R) of 0.438 and weighted average of 5.3%. Similarly, the statistical analysis conducted on geographies consisting of 217,626,533 people shows a poor positive correlation between the proportion of Immigrants from Haiti and unemployment rate among population between the ages 30 and 34 in the United States with a correlation coefficient (R) of 0.123 and weighted average of 6.2%, a difference of 17.3%.
Unemployment Among Ages 30 to 34 years Correlation Summary
| Measurement | Romanian | Immigrants from Haiti |
| Minimum | 0.80% | 0.90% |
| Maximum | 53.8% | 20.0% |
| Range | 53.0% | 19.1% |
| Mean | 8.5% | 6.8% |
| Median | 5.5% | 6.1% |
| Interquartile 25% (IQ1) | 4.7% | 5.4% |
| Interquartile 75% (IQ3) | 7.1% | 7.5% |
| Interquartile Range (IQR) | 2.4% | 2.1% |
| Standard Deviation (Sample) | 10.8% | 3.2% |
| Standard Deviation (Population) | 10.5% | 3.2% |
Similar Demographics by Unemployment Among Ages 30 to 34 years
Demographics Similar to Romanians by Unemployment Among Ages 30 to 34 years
In terms of unemployment among ages 30 to 34 years, the demographic groups most similar to Romanians are Immigrants from Poland (5.3%, a difference of 0.010%), New Zealander (5.3%, a difference of 0.030%), Immigrants from Netherlands (5.3%, a difference of 0.050%), Immigrants from South Africa (5.3%, a difference of 0.090%), and Australian (5.3%, a difference of 0.10%).
| Demographics | Rating | Rank | Unemployment Among Ages 30 to 34 years |
| Estonians | 83.7 /100 | #114 | Excellent 5.3% |
| Immigrants | Albania | 83.4 /100 | #115 | Excellent 5.3% |
| Eastern Europeans | 83.2 /100 | #116 | Excellent 5.3% |
| Australians | 83.1 /100 | #117 | Excellent 5.3% |
| Immigrants | South Africa | 83.0 /100 | #118 | Excellent 5.3% |
| New Zealanders | 82.5 /100 | #119 | Excellent 5.3% |
| Immigrants | Poland | 82.4 /100 | #120 | Excellent 5.3% |
| Romanians | 82.3 /100 | #121 | Excellent 5.3% |
| Immigrants | Netherlands | 81.8 /100 | #122 | Excellent 5.3% |
| Immigrants | Italy | 81.1 /100 | #123 | Excellent 5.3% |
| Immigrants | Brazil | 80.8 /100 | #124 | Excellent 5.3% |
| Greeks | 80.4 /100 | #125 | Excellent 5.3% |
| Immigrants | Sri Lanka | 80.2 /100 | #126 | Excellent 5.3% |
| Taiwanese | 79.4 /100 | #127 | Good 5.3% |
| Immigrants | Uruguay | 79.3 /100 | #128 | Good 5.3% |
Demographics Similar to Immigrants from Haiti by Unemployment Among Ages 30 to 34 years
In terms of unemployment among ages 30 to 34 years, the demographic groups most similar to Immigrants from Haiti are Immigrants from Mexico (6.2%, a difference of 0.16%), French American Indian (6.3%, a difference of 0.30%), Immigrants from Senegal (6.3%, a difference of 0.31%), Seminole (6.2%, a difference of 0.35%), and American (6.2%, a difference of 0.45%).
| Demographics | Rating | Rank | Unemployment Among Ages 30 to 34 years |
| Immigrants | Western Africa | 0.1 /100 | #261 | Tragic 6.2% |
| Immigrants | Central America | 0.1 /100 | #262 | Tragic 6.2% |
| Spanish Americans | 0.0 /100 | #263 | Tragic 6.2% |
| Chickasaw | 0.0 /100 | #264 | Tragic 6.2% |
| Americans | 0.0 /100 | #265 | Tragic 6.2% |
| Seminole | 0.0 /100 | #266 | Tragic 6.2% |
| Immigrants | Mexico | 0.0 /100 | #267 | Tragic 6.2% |
| Immigrants | Haiti | 0.0 /100 | #268 | Tragic 6.2% |
| French American Indians | 0.0 /100 | #269 | Tragic 6.3% |
| Immigrants | Senegal | 0.0 /100 | #270 | Tragic 6.3% |
| Comanche | 0.0 /100 | #271 | Tragic 6.3% |
| Blackfeet | 0.0 /100 | #272 | Tragic 6.3% |
| Ottawa | 0.0 /100 | #273 | Tragic 6.3% |
| U.S. Virgin Islanders | 0.0 /100 | #274 | Tragic 6.3% |
| Ecuadorians | 0.0 /100 | #275 | Tragic 6.3% |