Romanian vs Immigrants from Southern Europe Unemployment Among Ages 30 to 34 years
COMPARE
Romanian
Immigrants from Southern Europe
Unemployment Among Ages 30 to 34 years
Unemployment Among Ages 30 to 34 years Comparison
Romanians
Immigrants from Southern Europe
5.3%
UNEMPLOYMENT AMONG AGES 30 TO 34 YEARS
82.3/ 100
METRIC RATING
121st/ 347
METRIC RANK
5.6%
UNEMPLOYMENT AMONG AGES 30 TO 34 YEARS
25.8/ 100
METRIC RATING
200th/ 347
METRIC RANK
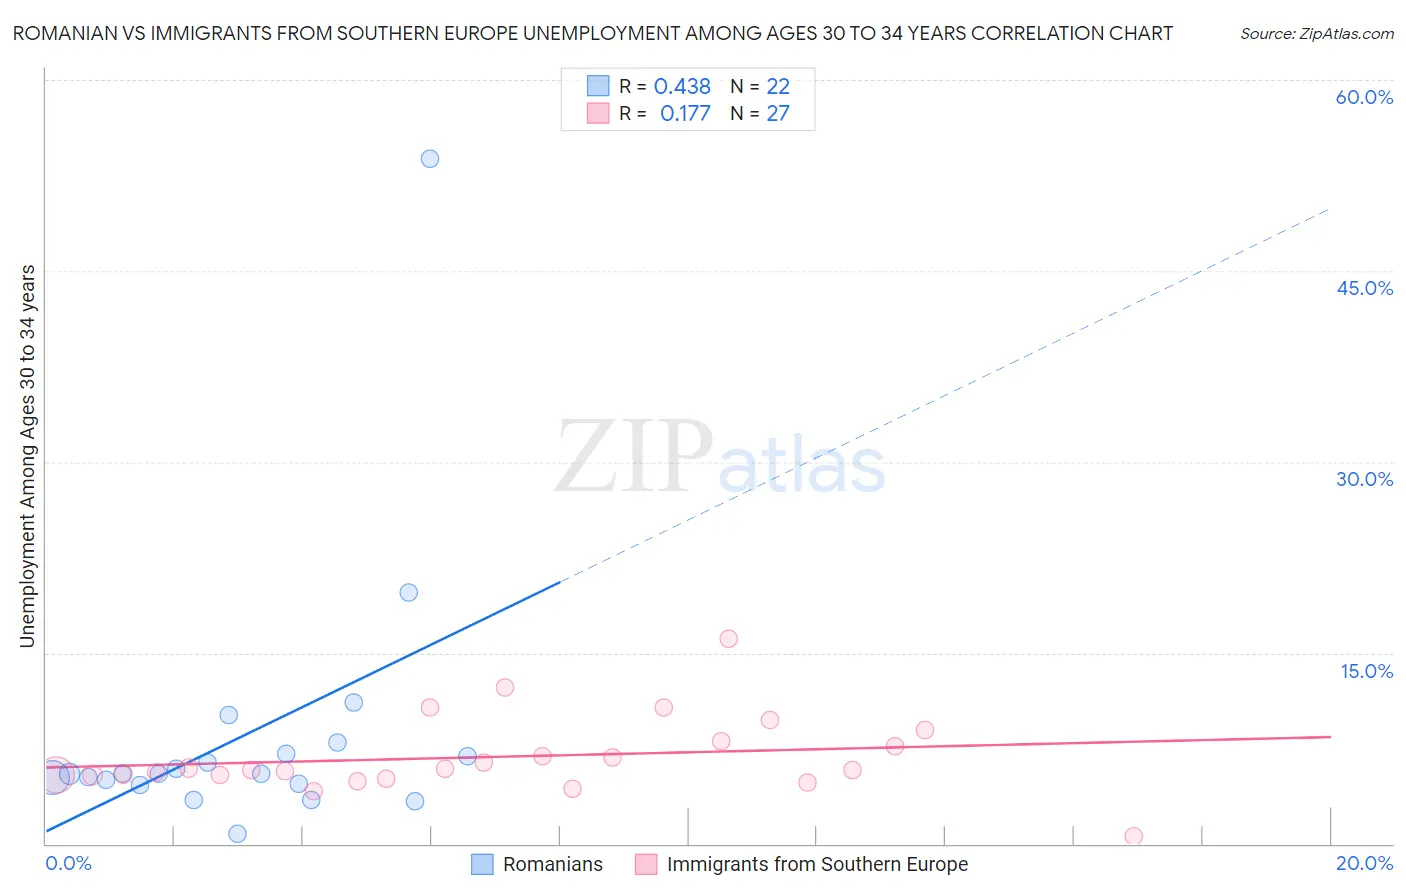
Romanian vs Immigrants from Southern Europe Unemployment Among Ages 30 to 34 years Correlation Chart
The statistical analysis conducted on geographies consisting of 355,508,215 people shows a moderate positive correlation between the proportion of Romanians and unemployment rate among population between the ages 30 and 34 in the United States with a correlation coefficient (R) of 0.438 and weighted average of 5.3%. Similarly, the statistical analysis conducted on geographies consisting of 377,350,027 people shows a poor positive correlation between the proportion of Immigrants from Southern Europe and unemployment rate among population between the ages 30 and 34 in the United States with a correlation coefficient (R) of 0.177 and weighted average of 5.6%, a difference of 4.6%.
Unemployment Among Ages 30 to 34 years Correlation Summary
| Measurement | Romanian | Immigrants from Southern Europe |
| Minimum | 0.80% | 0.60% |
| Maximum | 53.8% | 16.1% |
| Range | 53.0% | 15.5% |
| Mean | 8.5% | 6.8% |
| Median | 5.5% | 5.8% |
| Interquartile 25% (IQ1) | 4.7% | 5.4% |
| Interquartile 75% (IQ3) | 7.1% | 8.1% |
| Interquartile Range (IQR) | 2.4% | 2.7% |
| Standard Deviation (Sample) | 10.8% | 3.0% |
| Standard Deviation (Population) | 10.5% | 3.0% |
Similar Demographics by Unemployment Among Ages 30 to 34 years
Demographics Similar to Romanians by Unemployment Among Ages 30 to 34 years
In terms of unemployment among ages 30 to 34 years, the demographic groups most similar to Romanians are Immigrants from Poland (5.3%, a difference of 0.010%), New Zealander (5.3%, a difference of 0.030%), Immigrants from Netherlands (5.3%, a difference of 0.050%), Immigrants from South Africa (5.3%, a difference of 0.090%), and Australian (5.3%, a difference of 0.10%).
| Demographics | Rating | Rank | Unemployment Among Ages 30 to 34 years |
| Estonians | 83.7 /100 | #114 | Excellent 5.3% |
| Immigrants | Albania | 83.4 /100 | #115 | Excellent 5.3% |
| Eastern Europeans | 83.2 /100 | #116 | Excellent 5.3% |
| Australians | 83.1 /100 | #117 | Excellent 5.3% |
| Immigrants | South Africa | 83.0 /100 | #118 | Excellent 5.3% |
| New Zealanders | 82.5 /100 | #119 | Excellent 5.3% |
| Immigrants | Poland | 82.4 /100 | #120 | Excellent 5.3% |
| Romanians | 82.3 /100 | #121 | Excellent 5.3% |
| Immigrants | Netherlands | 81.8 /100 | #122 | Excellent 5.3% |
| Immigrants | Italy | 81.1 /100 | #123 | Excellent 5.3% |
| Immigrants | Brazil | 80.8 /100 | #124 | Excellent 5.3% |
| Greeks | 80.4 /100 | #125 | Excellent 5.3% |
| Immigrants | Sri Lanka | 80.2 /100 | #126 | Excellent 5.3% |
| Taiwanese | 79.4 /100 | #127 | Good 5.3% |
| Immigrants | Uruguay | 79.3 /100 | #128 | Good 5.3% |
Demographics Similar to Immigrants from Southern Europe by Unemployment Among Ages 30 to 34 years
In terms of unemployment among ages 30 to 34 years, the demographic groups most similar to Immigrants from Southern Europe are Nicaraguan (5.6%, a difference of 0.070%), Immigrants from Afghanistan (5.6%, a difference of 0.13%), South American Indian (5.6%, a difference of 0.13%), Immigrants from Nicaragua (5.5%, a difference of 0.27%), and Immigrants from Germany (5.6%, a difference of 0.27%).
| Demographics | Rating | Rank | Unemployment Among Ages 30 to 34 years |
| Immigrants | Africa | 31.0 /100 | #193 | Fair 5.5% |
| Slavs | 30.9 /100 | #194 | Fair 5.5% |
| Finns | 30.7 /100 | #195 | Fair 5.5% |
| Immigrants | South America | 29.8 /100 | #196 | Fair 5.5% |
| Immigrants | Nicaragua | 28.9 /100 | #197 | Fair 5.5% |
| Immigrants | Afghanistan | 27.2 /100 | #198 | Fair 5.6% |
| Nicaraguans | 26.6 /100 | #199 | Fair 5.6% |
| Immigrants | Southern Europe | 25.8 /100 | #200 | Fair 5.6% |
| South American Indians | 24.4 /100 | #201 | Fair 5.6% |
| Immigrants | Germany | 22.9 /100 | #202 | Fair 5.6% |
| Koreans | 20.7 /100 | #203 | Fair 5.6% |
| Immigrants | Cameroon | 18.4 /100 | #204 | Poor 5.6% |
| Immigrants | Costa Rica | 14.4 /100 | #205 | Poor 5.6% |
| Alsatians | 14.3 /100 | #206 | Poor 5.6% |
| Israelis | 12.8 /100 | #207 | Poor 5.6% |