Salvadoran vs Immigrants from Haiti Unemployment Among Ages 30 to 34 years
COMPARE
Salvadoran
Immigrants from Haiti
Unemployment Among Ages 30 to 34 years
Unemployment Among Ages 30 to 34 years Comparison
Salvadorans
Immigrants from Haiti
6.0%
UNEMPLOYMENT AMONG AGES 30 TO 34 YEARS
0.5/ 100
METRIC RATING
240th/ 347
METRIC RANK
6.2%
UNEMPLOYMENT AMONG AGES 30 TO 34 YEARS
0.0/ 100
METRIC RATING
268th/ 347
METRIC RANK
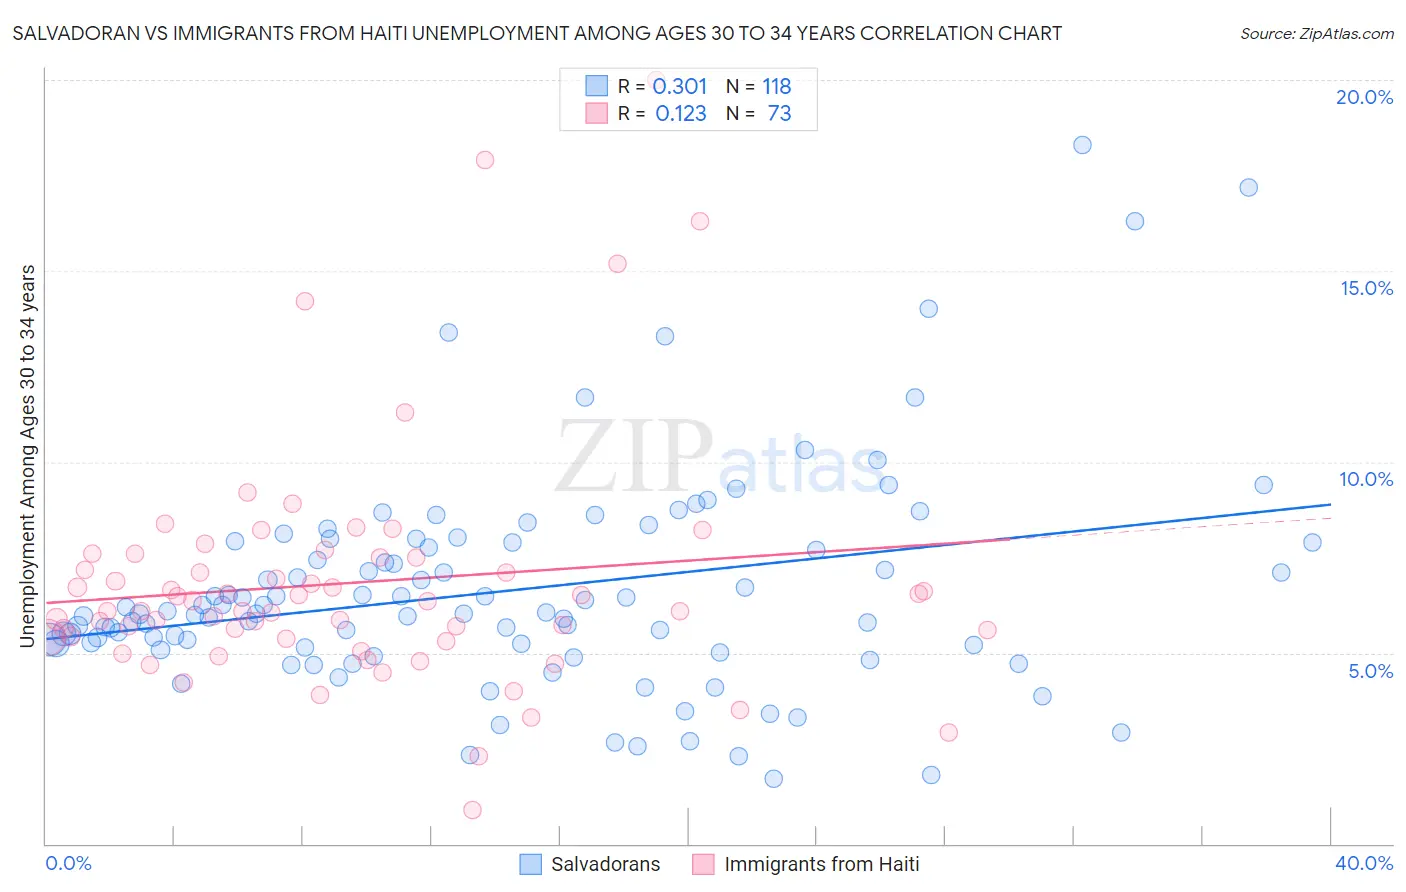
Salvadoran vs Immigrants from Haiti Unemployment Among Ages 30 to 34 years Correlation Chart
The statistical analysis conducted on geographies consisting of 378,904,026 people shows a mild positive correlation between the proportion of Salvadorans and unemployment rate among population between the ages 30 and 34 in the United States with a correlation coefficient (R) of 0.301 and weighted average of 6.0%. Similarly, the statistical analysis conducted on geographies consisting of 217,626,533 people shows a poor positive correlation between the proportion of Immigrants from Haiti and unemployment rate among population between the ages 30 and 34 in the United States with a correlation coefficient (R) of 0.123 and weighted average of 6.2%, a difference of 4.5%.
Unemployment Among Ages 30 to 34 years Correlation Summary
| Measurement | Salvadoran | Immigrants from Haiti |
| Minimum | 1.7% | 0.90% |
| Maximum | 18.3% | 20.0% |
| Range | 16.6% | 19.1% |
| Mean | 6.6% | 6.8% |
| Median | 6.0% | 6.1% |
| Interquartile 25% (IQ1) | 5.2% | 5.4% |
| Interquartile 75% (IQ3) | 7.9% | 7.5% |
| Interquartile Range (IQR) | 2.7% | 2.1% |
| Standard Deviation (Sample) | 2.8% | 3.2% |
| Standard Deviation (Population) | 2.8% | 3.2% |
Similar Demographics by Unemployment Among Ages 30 to 34 years
Demographics Similar to Salvadorans by Unemployment Among Ages 30 to 34 years
In terms of unemployment among ages 30 to 34 years, the demographic groups most similar to Salvadorans are Immigrants from El Salvador (6.0%, a difference of 0.070%), Immigrants from Nigeria (6.0%, a difference of 0.26%), Guatemalan (6.0%, a difference of 0.30%), Mexican American Indian (5.9%, a difference of 0.33%), and Immigrants from Liberia (6.0%, a difference of 0.36%).
| Demographics | Rating | Rank | Unemployment Among Ages 30 to 34 years |
| Nepalese | 0.8 /100 | #233 | Tragic 5.9% |
| Portuguese | 0.8 /100 | #234 | Tragic 5.9% |
| Yaqui | 0.7 /100 | #235 | Tragic 5.9% |
| Native Hawaiians | 0.7 /100 | #236 | Tragic 5.9% |
| Central Americans | 0.6 /100 | #237 | Tragic 5.9% |
| Mexican American Indians | 0.6 /100 | #238 | Tragic 5.9% |
| Immigrants | Nigeria | 0.6 /100 | #239 | Tragic 6.0% |
| Salvadorans | 0.5 /100 | #240 | Tragic 6.0% |
| Immigrants | El Salvador | 0.5 /100 | #241 | Tragic 6.0% |
| Guatemalans | 0.4 /100 | #242 | Tragic 6.0% |
| Immigrants | Liberia | 0.4 /100 | #243 | Tragic 6.0% |
| Immigrants | Micronesia | 0.3 /100 | #244 | Tragic 6.0% |
| Sub-Saharan Africans | 0.3 /100 | #245 | Tragic 6.0% |
| Ghanaians | 0.3 /100 | #246 | Tragic 6.0% |
| Nigerians | 0.3 /100 | #247 | Tragic 6.0% |
Demographics Similar to Immigrants from Haiti by Unemployment Among Ages 30 to 34 years
In terms of unemployment among ages 30 to 34 years, the demographic groups most similar to Immigrants from Haiti are Immigrants from Mexico (6.2%, a difference of 0.16%), French American Indian (6.3%, a difference of 0.30%), Immigrants from Senegal (6.3%, a difference of 0.31%), Seminole (6.2%, a difference of 0.35%), and American (6.2%, a difference of 0.45%).
| Demographics | Rating | Rank | Unemployment Among Ages 30 to 34 years |
| Immigrants | Western Africa | 0.1 /100 | #261 | Tragic 6.2% |
| Immigrants | Central America | 0.1 /100 | #262 | Tragic 6.2% |
| Spanish Americans | 0.0 /100 | #263 | Tragic 6.2% |
| Chickasaw | 0.0 /100 | #264 | Tragic 6.2% |
| Americans | 0.0 /100 | #265 | Tragic 6.2% |
| Seminole | 0.0 /100 | #266 | Tragic 6.2% |
| Immigrants | Mexico | 0.0 /100 | #267 | Tragic 6.2% |
| Immigrants | Haiti | 0.0 /100 | #268 | Tragic 6.2% |
| French American Indians | 0.0 /100 | #269 | Tragic 6.3% |
| Immigrants | Senegal | 0.0 /100 | #270 | Tragic 6.3% |
| Comanche | 0.0 /100 | #271 | Tragic 6.3% |
| Blackfeet | 0.0 /100 | #272 | Tragic 6.3% |
| Ottawa | 0.0 /100 | #273 | Tragic 6.3% |
| U.S. Virgin Islanders | 0.0 /100 | #274 | Tragic 6.3% |
| Ecuadorians | 0.0 /100 | #275 | Tragic 6.3% |