Puget Sound Salish vs Polish Unemployment Among Ages 25 to 29 years
COMPARE
Puget Sound Salish
Polish
Unemployment Among Ages 25 to 29 years
Unemployment Among Ages 25 to 29 years Comparison
Puget Sound Salish
Poles
7.1%
UNEMPLOYMENT AMONG AGES 25 TO 29 YEARS
1.8/ 100
METRIC RATING
237th/ 347
METRIC RANK
6.5%
UNEMPLOYMENT AMONG AGES 25 TO 29 YEARS
76.6/ 100
METRIC RATING
132nd/ 347
METRIC RANK
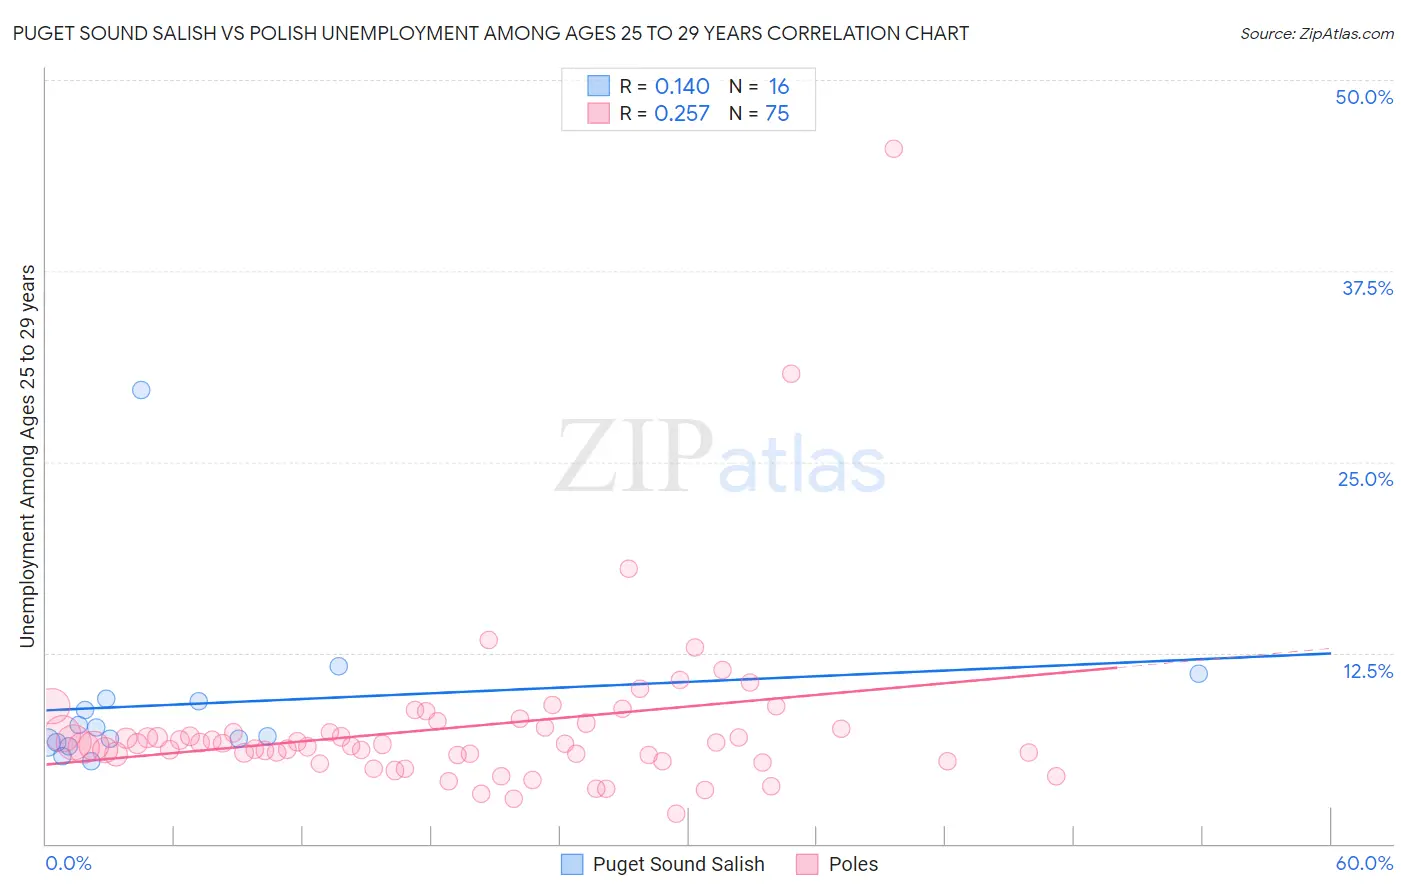
Puget Sound Salish vs Polish Unemployment Among Ages 25 to 29 years Correlation Chart
The statistical analysis conducted on geographies consisting of 45,327,294 people shows a poor positive correlation between the proportion of Puget Sound Salish and unemployment rate among population between the ages 25 and 29 in the United States with a correlation coefficient (R) of 0.140 and weighted average of 7.1%. Similarly, the statistical analysis conducted on geographies consisting of 499,723,936 people shows a weak positive correlation between the proportion of Poles and unemployment rate among population between the ages 25 and 29 in the United States with a correlation coefficient (R) of 0.257 and weighted average of 6.5%, a difference of 8.1%.
Unemployment Among Ages 25 to 29 years Correlation Summary
| Measurement | Puget Sound Salish | Polish |
| Minimum | 5.4% | 2.0% |
| Maximum | 29.7% | 45.5% |
| Range | 24.4% | 43.5% |
| Mean | 9.2% | 7.6% |
| Median | 7.3% | 6.5% |
| Interquartile 25% (IQ1) | 6.6% | 5.8% |
| Interquartile 75% (IQ3) | 9.4% | 7.6% |
| Interquartile Range (IQR) | 2.8% | 1.9% |
| Standard Deviation (Sample) | 5.8% | 5.8% |
| Standard Deviation (Population) | 5.6% | 5.7% |
Similar Demographics by Unemployment Among Ages 25 to 29 years
Demographics Similar to Puget Sound Salish by Unemployment Among Ages 25 to 29 years
In terms of unemployment among ages 25 to 29 years, the demographic groups most similar to Puget Sound Salish are Honduran (7.1%, a difference of 0.020%), Cape Verdean (7.0%, a difference of 0.070%), Panamanian (7.0%, a difference of 0.21%), French Canadian (7.0%, a difference of 0.37%), and Immigrants from Honduras (7.0%, a difference of 0.39%).
| Demographics | Rating | Rank | Unemployment Among Ages 25 to 29 years |
| Immigrants | El Salvador | 3.6 /100 | #230 | Tragic 7.0% |
| Central Americans | 3.0 /100 | #231 | Tragic 7.0% |
| Spanish Americans | 2.7 /100 | #232 | Tragic 7.0% |
| Immigrants | Honduras | 2.4 /100 | #233 | Tragic 7.0% |
| French Canadians | 2.4 /100 | #234 | Tragic 7.0% |
| Panamanians | 2.1 /100 | #235 | Tragic 7.0% |
| Cape Verdeans | 1.9 /100 | #236 | Tragic 7.0% |
| Puget Sound Salish | 1.8 /100 | #237 | Tragic 7.1% |
| Hondurans | 1.8 /100 | #238 | Tragic 7.1% |
| Potawatomi | 1.3 /100 | #239 | Tragic 7.1% |
| Native Hawaiians | 1.3 /100 | #240 | Tragic 7.1% |
| Immigrants | Sierra Leone | 1.3 /100 | #241 | Tragic 7.1% |
| Spanish American Indians | 1.1 /100 | #242 | Tragic 7.1% |
| Yaqui | 1.0 /100 | #243 | Tragic 7.1% |
| Immigrants | Nonimmigrants | 0.9 /100 | #244 | Tragic 7.1% |
Demographics Similar to Poles by Unemployment Among Ages 25 to 29 years
In terms of unemployment among ages 25 to 29 years, the demographic groups most similar to Poles are Immigrants from Europe (6.5%, a difference of 0.080%), Immigrants from Vietnam (6.5%, a difference of 0.090%), Immigrants from Croatia (6.5%, a difference of 0.090%), Northern European (6.5%, a difference of 0.11%), and Eastern European (6.5%, a difference of 0.22%).
| Demographics | Rating | Rank | Unemployment Among Ages 25 to 29 years |
| Syrians | 82.1 /100 | #125 | Excellent 6.5% |
| Brazilians | 81.9 /100 | #126 | Excellent 6.5% |
| Dutch | 80.6 /100 | #127 | Excellent 6.5% |
| Immigrants | Chile | 80.5 /100 | #128 | Excellent 6.5% |
| Sri Lankans | 80.3 /100 | #129 | Excellent 6.5% |
| Immigrants | Peru | 79.9 /100 | #130 | Good 6.5% |
| Immigrants | Afghanistan | 79.2 /100 | #131 | Good 6.5% |
| Poles | 76.6 /100 | #132 | Good 6.5% |
| Immigrants | Europe | 75.7 /100 | #133 | Good 6.5% |
| Immigrants | Vietnam | 75.6 /100 | #134 | Good 6.5% |
| Immigrants | Croatia | 75.5 /100 | #135 | Good 6.5% |
| Northern Europeans | 75.4 /100 | #136 | Good 6.5% |
| Eastern Europeans | 74.1 /100 | #137 | Good 6.5% |
| Immigrants | Belgium | 73.8 /100 | #138 | Good 6.5% |
| Austrians | 73.8 /100 | #139 | Good 6.5% |