Puerto Rican vs Pueblo Unemployment Among Ages 35 to 44 years
COMPARE
Puerto Rican
Pueblo
Unemployment Among Ages 35 to 44 years
Unemployment Among Ages 35 to 44 years Comparison
Puerto Ricans
Pueblo
7.6%
UNEMPLOYMENT AMONG AGES 35 TO 44 YEARS
0.0/ 100
METRIC RATING
333rd/ 347
METRIC RANK
7.1%
UNEMPLOYMENT AMONG AGES 35 TO 44 YEARS
0.0/ 100
METRIC RATING
331st/ 347
METRIC RANK
Puerto Rican vs Pueblo Unemployment Among Ages 35 to 44 years Correlation Chart
The statistical analysis conducted on geographies consisting of 505,130,223 people shows a moderate positive correlation between the proportion of Puerto Ricans and unemployment rate among population between the ages 35 and 44 in the United States with a correlation coefficient (R) of 0.493 and weighted average of 7.6%. Similarly, the statistical analysis conducted on geographies consisting of 119,202,461 people shows a weak positive correlation between the proportion of Pueblo and unemployment rate among population between the ages 35 and 44 in the United States with a correlation coefficient (R) of 0.244 and weighted average of 7.1%, a difference of 8.3%.
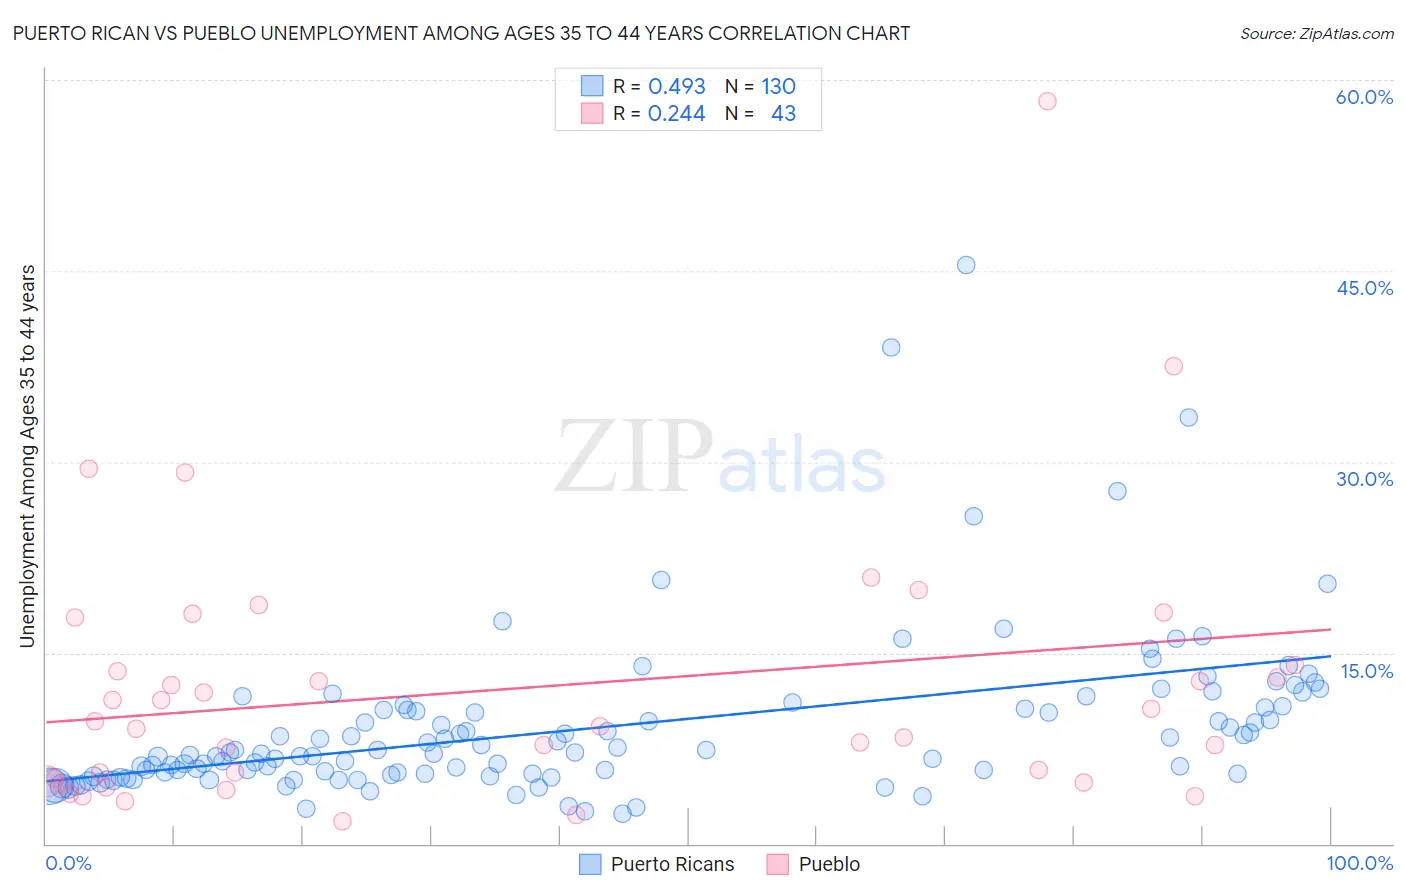
Unemployment Among Ages 35 to 44 years Correlation Summary
| Measurement | Puerto Rican | Pueblo |
| Minimum | 2.4% | 1.8% |
| Maximum | 45.5% | 58.3% |
| Range | 43.1% | 56.5% |
| Mean | 9.1% | 12.2% |
| Median | 7.1% | 9.2% |
| Interquartile 25% (IQ1) | 5.5% | 4.9% |
| Interquartile 75% (IQ3) | 10.6% | 14.0% |
| Interquartile Range (IQR) | 5.1% | 9.1% |
| Standard Deviation (Sample) | 6.4% | 10.6% |
| Standard Deviation (Population) | 6.4% | 10.5% |
Demographics Similar to Puerto Ricans and Pueblo by Unemployment Among Ages 35 to 44 years
In terms of unemployment among ages 35 to 44 years, the demographic groups most similar to Puerto Ricans are Houma (7.8%, a difference of 2.7%), Native/Alaskan (7.3%, a difference of 5.2%), Sioux (8.4%, a difference of 9.8%), Apache (8.4%, a difference of 10.1%), and Tohono O'odham (8.4%, a difference of 10.5%). Similarly, the demographic groups most similar to Pueblo are Immigrants from Cabo Verde (6.9%, a difference of 2.5%), Paiute (6.9%, a difference of 2.5%), Native/Alaskan (7.3%, a difference of 2.9%), Shoshone (6.6%, a difference of 6.7%), and Cape Verdean (6.6%, a difference of 7.4%).
| Demographics | Rating | Rank | Unemployment Among Ages 35 to 44 years |
| Immigrants | Dominican Republic | 0.0 /100 | #322 | Tragic 6.4% |
| Dominicans | 0.0 /100 | #323 | Tragic 6.4% |
| Menominee | 0.0 /100 | #324 | Tragic 6.5% |
| Immigrants | Yemen | 0.0 /100 | #325 | Tragic 6.6% |
| Alaska Natives | 0.0 /100 | #326 | Tragic 6.6% |
| Cape Verdeans | 0.0 /100 | #327 | Tragic 6.6% |
| Shoshone | 0.0 /100 | #328 | Tragic 6.6% |
| Paiute | 0.0 /100 | #329 | Tragic 6.9% |
| Immigrants | Cabo Verde | 0.0 /100 | #330 | Tragic 6.9% |
| Pueblo | 0.0 /100 | #331 | Tragic 7.1% |
| Natives/Alaskans | 0.0 /100 | #332 | Tragic 7.3% |
| Puerto Ricans | 0.0 /100 | #333 | Tragic 7.6% |
| Houma | 0.0 /100 | #334 | Tragic 7.8% |
| Sioux | 0.0 /100 | #335 | Tragic 8.4% |
| Apache | 0.0 /100 | #336 | Tragic 8.4% |
| Tohono O'odham | 0.0 /100 | #337 | Tragic 8.4% |
| Cheyenne | 0.0 /100 | #338 | Tragic 8.5% |
| Inupiat | 0.0 /100 | #339 | Tragic 8.6% |
| Alaskan Athabascans | 0.0 /100 | #340 | Tragic 8.6% |
| Hopi | 0.0 /100 | #341 | Tragic 8.9% |
| Navajo | 0.0 /100 | #342 | Tragic 9.3% |