Puerto Rican vs Slavic Unemployment Among Ages 35 to 44 years
COMPARE
Puerto Rican
Slavic
Unemployment Among Ages 35 to 44 years
Unemployment Among Ages 35 to 44 years Comparison
Puerto Ricans
Slavs
7.6%
UNEMPLOYMENT AMONG AGES 35 TO 44 YEARS
0.0/ 100
METRIC RATING
333rd/ 347
METRIC RANK
4.6%
UNEMPLOYMENT AMONG AGES 35 TO 44 YEARS
72.4/ 100
METRIC RATING
148th/ 347
METRIC RANK
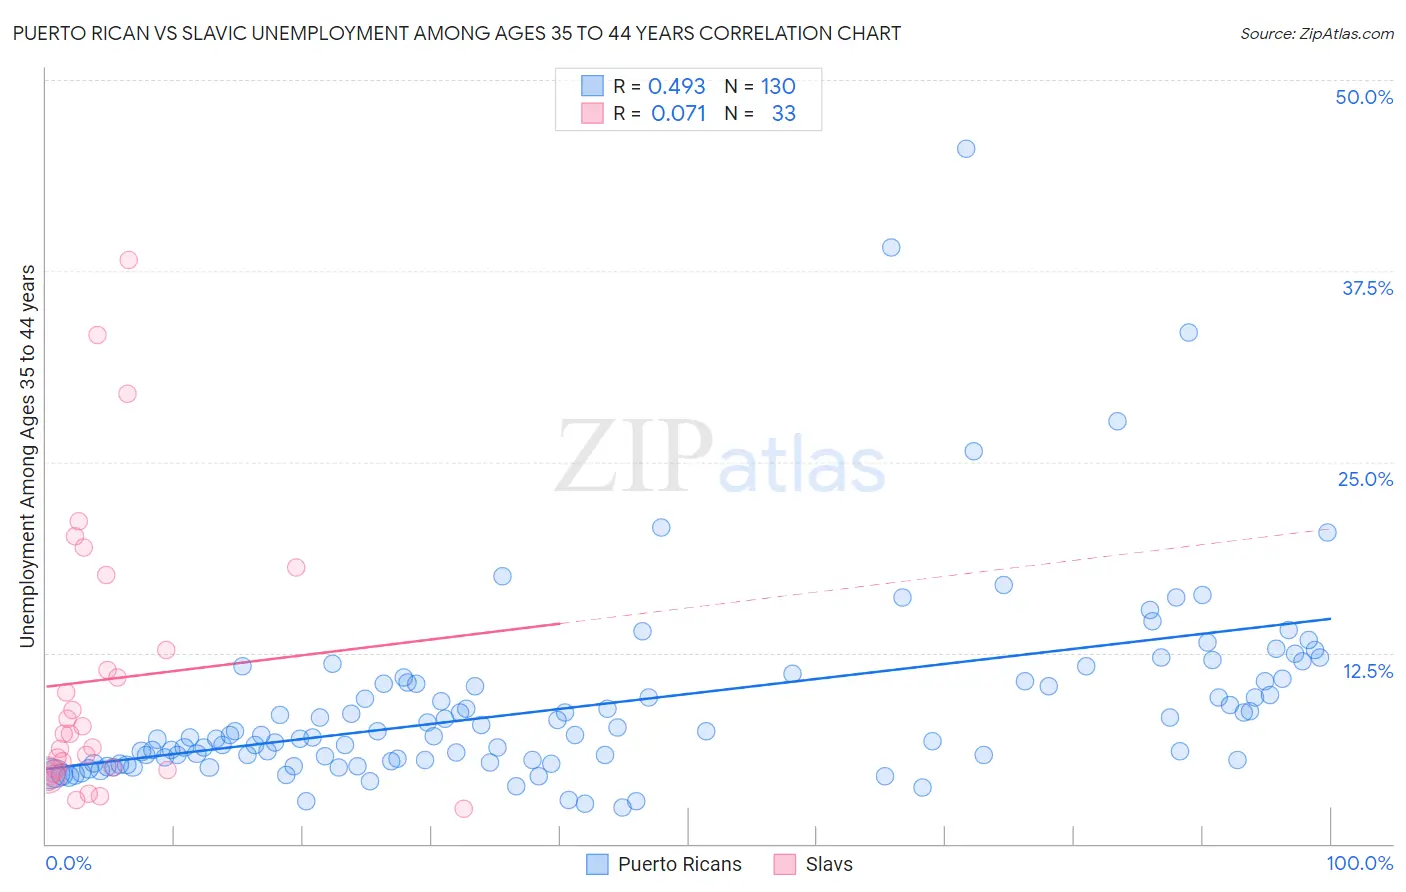
Puerto Rican vs Slavic Unemployment Among Ages 35 to 44 years Correlation Chart
The statistical analysis conducted on geographies consisting of 505,130,223 people shows a moderate positive correlation between the proportion of Puerto Ricans and unemployment rate among population between the ages 35 and 44 in the United States with a correlation coefficient (R) of 0.493 and weighted average of 7.6%. Similarly, the statistical analysis conducted on geographies consisting of 265,902,983 people shows a slight positive correlation between the proportion of Slavs and unemployment rate among population between the ages 35 and 44 in the United States with a correlation coefficient (R) of 0.071 and weighted average of 4.6%, a difference of 65.6%.
Unemployment Among Ages 35 to 44 years Correlation Summary
| Measurement | Puerto Rican | Slavic |
| Minimum | 2.4% | 2.3% |
| Maximum | 45.5% | 38.2% |
| Range | 43.1% | 35.9% |
| Mean | 9.1% | 10.7% |
| Median | 7.1% | 7.2% |
| Interquartile 25% (IQ1) | 5.5% | 4.7% |
| Interquartile 75% (IQ3) | 10.6% | 15.1% |
| Interquartile Range (IQR) | 5.1% | 10.4% |
| Standard Deviation (Sample) | 6.4% | 9.1% |
| Standard Deviation (Population) | 6.4% | 9.0% |
Similar Demographics by Unemployment Among Ages 35 to 44 years
Demographics Similar to Puerto Ricans by Unemployment Among Ages 35 to 44 years
In terms of unemployment among ages 35 to 44 years, the demographic groups most similar to Puerto Ricans are Houma (7.8%, a difference of 2.7%), Native/Alaskan (7.3%, a difference of 5.2%), Pueblo (7.1%, a difference of 8.3%), Sioux (8.4%, a difference of 9.8%), and Apache (8.4%, a difference of 10.1%).
| Demographics | Rating | Rank | Unemployment Among Ages 35 to 44 years |
| Alaska Natives | 0.0 /100 | #326 | Tragic 6.6% |
| Cape Verdeans | 0.0 /100 | #327 | Tragic 6.6% |
| Shoshone | 0.0 /100 | #328 | Tragic 6.6% |
| Paiute | 0.0 /100 | #329 | Tragic 6.9% |
| Immigrants | Cabo Verde | 0.0 /100 | #330 | Tragic 6.9% |
| Pueblo | 0.0 /100 | #331 | Tragic 7.1% |
| Natives/Alaskans | 0.0 /100 | #332 | Tragic 7.3% |
| Puerto Ricans | 0.0 /100 | #333 | Tragic 7.6% |
| Houma | 0.0 /100 | #334 | Tragic 7.8% |
| Sioux | 0.0 /100 | #335 | Tragic 8.4% |
| Apache | 0.0 /100 | #336 | Tragic 8.4% |
| Tohono O'odham | 0.0 /100 | #337 | Tragic 8.4% |
| Cheyenne | 0.0 /100 | #338 | Tragic 8.5% |
| Inupiat | 0.0 /100 | #339 | Tragic 8.6% |
| Alaskan Athabascans | 0.0 /100 | #340 | Tragic 8.6% |
Demographics Similar to Slavs by Unemployment Among Ages 35 to 44 years
In terms of unemployment among ages 35 to 44 years, the demographic groups most similar to Slavs are Immigrants from Burma/Myanmar (4.6%, a difference of 0.020%), Immigrants from Vietnam (4.6%, a difference of 0.12%), Immigrants from England (4.6%, a difference of 0.17%), Immigrants from Denmark (4.6%, a difference of 0.18%), and Immigrants from Eastern Europe (4.6%, a difference of 0.20%).
| Demographics | Rating | Rank | Unemployment Among Ages 35 to 44 years |
| Canadians | 75.9 /100 | #141 | Good 4.6% |
| Ukrainians | 75.8 /100 | #142 | Good 4.6% |
| Immigrants | Switzerland | 75.5 /100 | #143 | Good 4.6% |
| Immigrants | Russia | 75.4 /100 | #144 | Good 4.6% |
| Immigrants | Eastern Europe | 74.7 /100 | #145 | Good 4.6% |
| Immigrants | Denmark | 74.4 /100 | #146 | Good 4.6% |
| Immigrants | Vietnam | 73.8 /100 | #147 | Good 4.6% |
| Slavs | 72.4 /100 | #148 | Good 4.6% |
| Immigrants | Burma/Myanmar | 72.2 /100 | #149 | Good 4.6% |
| Immigrants | England | 70.5 /100 | #150 | Good 4.6% |
| Puget Sound Salish | 67.1 /100 | #151 | Good 4.6% |
| Pakistanis | 67.1 /100 | #152 | Good 4.6% |
| Immigrants | Brazil | 67.0 /100 | #153 | Good 4.6% |
| Immigrants | Western Europe | 65.5 /100 | #154 | Good 4.6% |
| Whites/Caucasians | 64.9 /100 | #155 | Good 4.6% |