Nicaraguan vs Pueblo Unemployment Among Ages 35 to 44 years
COMPARE
Nicaraguan
Pueblo
Unemployment Among Ages 35 to 44 years
Unemployment Among Ages 35 to 44 years Comparison
Nicaraguans
Pueblo
4.5%
UNEMPLOYMENT AMONG AGES 35 TO 44 YEARS
87.6/ 100
METRIC RATING
119th/ 347
METRIC RANK
7.1%
UNEMPLOYMENT AMONG AGES 35 TO 44 YEARS
0.0/ 100
METRIC RATING
331st/ 347
METRIC RANK
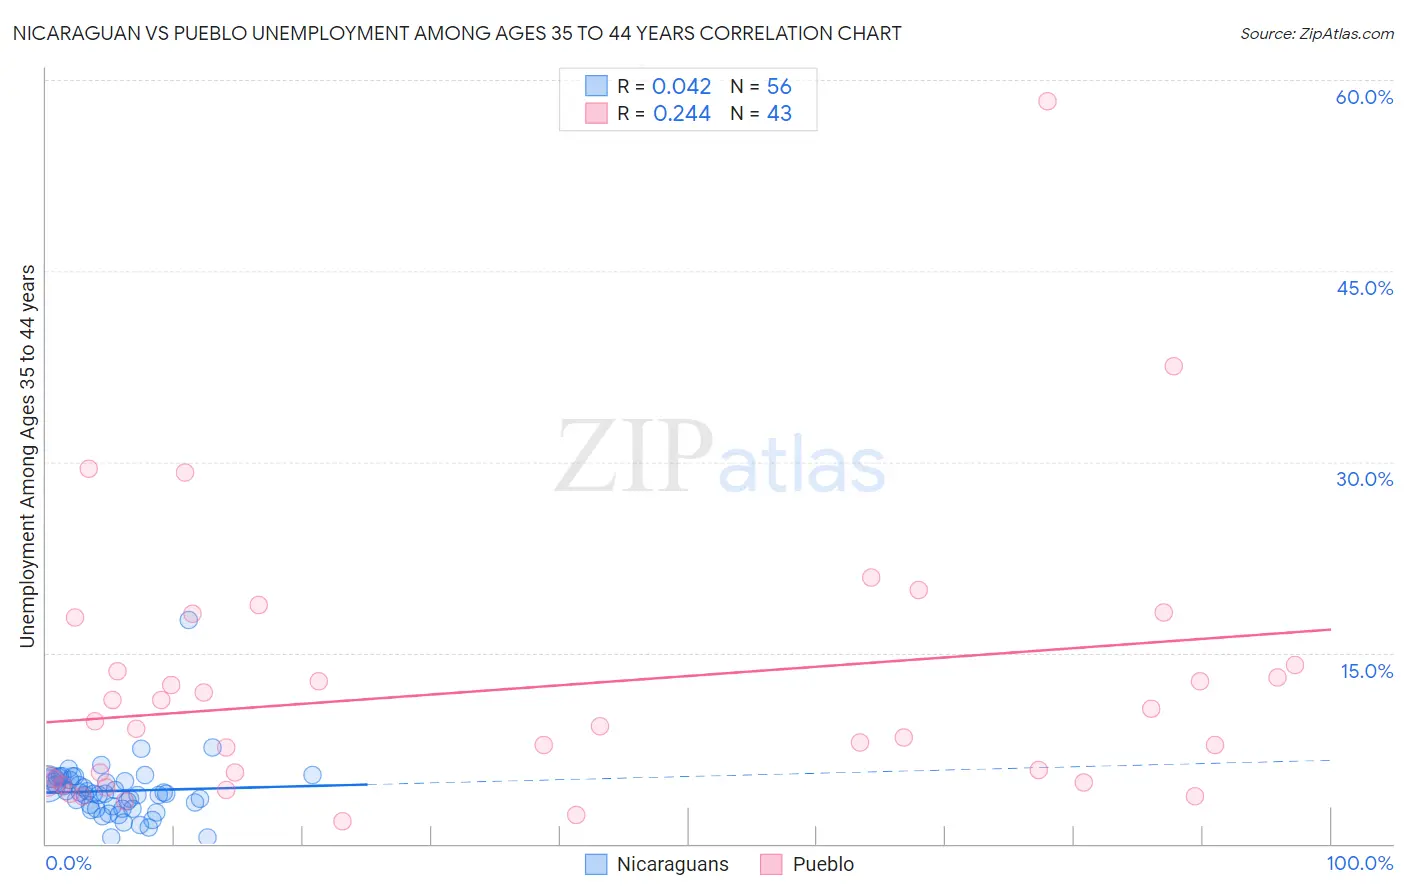
Nicaraguan vs Pueblo Unemployment Among Ages 35 to 44 years Correlation Chart
The statistical analysis conducted on geographies consisting of 282,755,900 people shows no correlation between the proportion of Nicaraguans and unemployment rate among population between the ages 35 and 44 in the United States with a correlation coefficient (R) of 0.042 and weighted average of 4.5%. Similarly, the statistical analysis conducted on geographies consisting of 119,202,461 people shows a weak positive correlation between the proportion of Pueblo and unemployment rate among population between the ages 35 and 44 in the United States with a correlation coefficient (R) of 0.244 and weighted average of 7.1%, a difference of 55.7%.
Unemployment Among Ages 35 to 44 years Correlation Summary
| Measurement | Nicaraguan | Pueblo |
| Minimum | 0.50% | 1.8% |
| Maximum | 17.6% | 58.3% |
| Range | 17.1% | 56.5% |
| Mean | 4.2% | 12.2% |
| Median | 4.0% | 9.2% |
| Interquartile 25% (IQ1) | 2.8% | 4.9% |
| Interquartile 75% (IQ3) | 4.9% | 14.0% |
| Interquartile Range (IQR) | 2.1% | 9.1% |
| Standard Deviation (Sample) | 2.4% | 10.6% |
| Standard Deviation (Population) | 2.3% | 10.5% |
Similar Demographics by Unemployment Among Ages 35 to 44 years
Demographics Similar to Nicaraguans by Unemployment Among Ages 35 to 44 years
In terms of unemployment among ages 35 to 44 years, the demographic groups most similar to Nicaraguans are Irish (4.5%, a difference of 0.050%), Immigrants from Greece (4.5%, a difference of 0.060%), Ethiopian (4.5%, a difference of 0.080%), Immigrants from Israel (4.5%, a difference of 0.090%), and Maltese (4.5%, a difference of 0.10%).
| Demographics | Rating | Rank | Unemployment Among Ages 35 to 44 years |
| Immigrants | Czechoslovakia | 89.2 /100 | #112 | Excellent 4.5% |
| Immigrants | Italy | 88.4 /100 | #113 | Excellent 4.5% |
| Macedonians | 88.3 /100 | #114 | Excellent 4.5% |
| Maltese | 88.1 /100 | #115 | Excellent 4.5% |
| Immigrants | Israel | 88.1 /100 | #116 | Excellent 4.5% |
| Immigrants | Greece | 87.9 /100 | #117 | Excellent 4.5% |
| Irish | 87.9 /100 | #118 | Excellent 4.5% |
| Nicaraguans | 87.6 /100 | #119 | Excellent 4.5% |
| Ethiopians | 87.1 /100 | #120 | Excellent 4.5% |
| Immigrants | South Africa | 86.8 /100 | #121 | Excellent 4.5% |
| Sri Lankans | 86.8 /100 | #122 | Excellent 4.5% |
| Basques | 86.3 /100 | #123 | Excellent 4.5% |
| Immigrants | Spain | 86.1 /100 | #124 | Excellent 4.5% |
| Immigrants | Northern Africa | 86.1 /100 | #125 | Excellent 4.5% |
| Immigrants | Austria | 84.7 /100 | #126 | Excellent 4.5% |
Demographics Similar to Pueblo by Unemployment Among Ages 35 to 44 years
In terms of unemployment among ages 35 to 44 years, the demographic groups most similar to Pueblo are Immigrants from Cabo Verde (6.9%, a difference of 2.5%), Paiute (6.9%, a difference of 2.5%), Native/Alaskan (7.3%, a difference of 2.9%), Shoshone (6.6%, a difference of 6.7%), and Cape Verdean (6.6%, a difference of 7.4%).
| Demographics | Rating | Rank | Unemployment Among Ages 35 to 44 years |
| Menominee | 0.0 /100 | #324 | Tragic 6.5% |
| Immigrants | Yemen | 0.0 /100 | #325 | Tragic 6.6% |
| Alaska Natives | 0.0 /100 | #326 | Tragic 6.6% |
| Cape Verdeans | 0.0 /100 | #327 | Tragic 6.6% |
| Shoshone | 0.0 /100 | #328 | Tragic 6.6% |
| Paiute | 0.0 /100 | #329 | Tragic 6.9% |
| Immigrants | Cabo Verde | 0.0 /100 | #330 | Tragic 6.9% |
| Pueblo | 0.0 /100 | #331 | Tragic 7.1% |
| Natives/Alaskans | 0.0 /100 | #332 | Tragic 7.3% |
| Puerto Ricans | 0.0 /100 | #333 | Tragic 7.6% |
| Houma | 0.0 /100 | #334 | Tragic 7.8% |
| Sioux | 0.0 /100 | #335 | Tragic 8.4% |
| Apache | 0.0 /100 | #336 | Tragic 8.4% |
| Tohono O'odham | 0.0 /100 | #337 | Tragic 8.4% |
| Cheyenne | 0.0 /100 | #338 | Tragic 8.5% |