Portuguese vs Pueblo Unemployment Among Ages 35 to 44 years
COMPARE
Portuguese
Pueblo
Unemployment Among Ages 35 to 44 years
Unemployment Among Ages 35 to 44 years Comparison
Portuguese
Pueblo
5.1%
UNEMPLOYMENT AMONG AGES 35 TO 44 YEARS
1.1/ 100
METRIC RATING
234th/ 347
METRIC RANK
7.1%
UNEMPLOYMENT AMONG AGES 35 TO 44 YEARS
0.0/ 100
METRIC RATING
331st/ 347
METRIC RANK
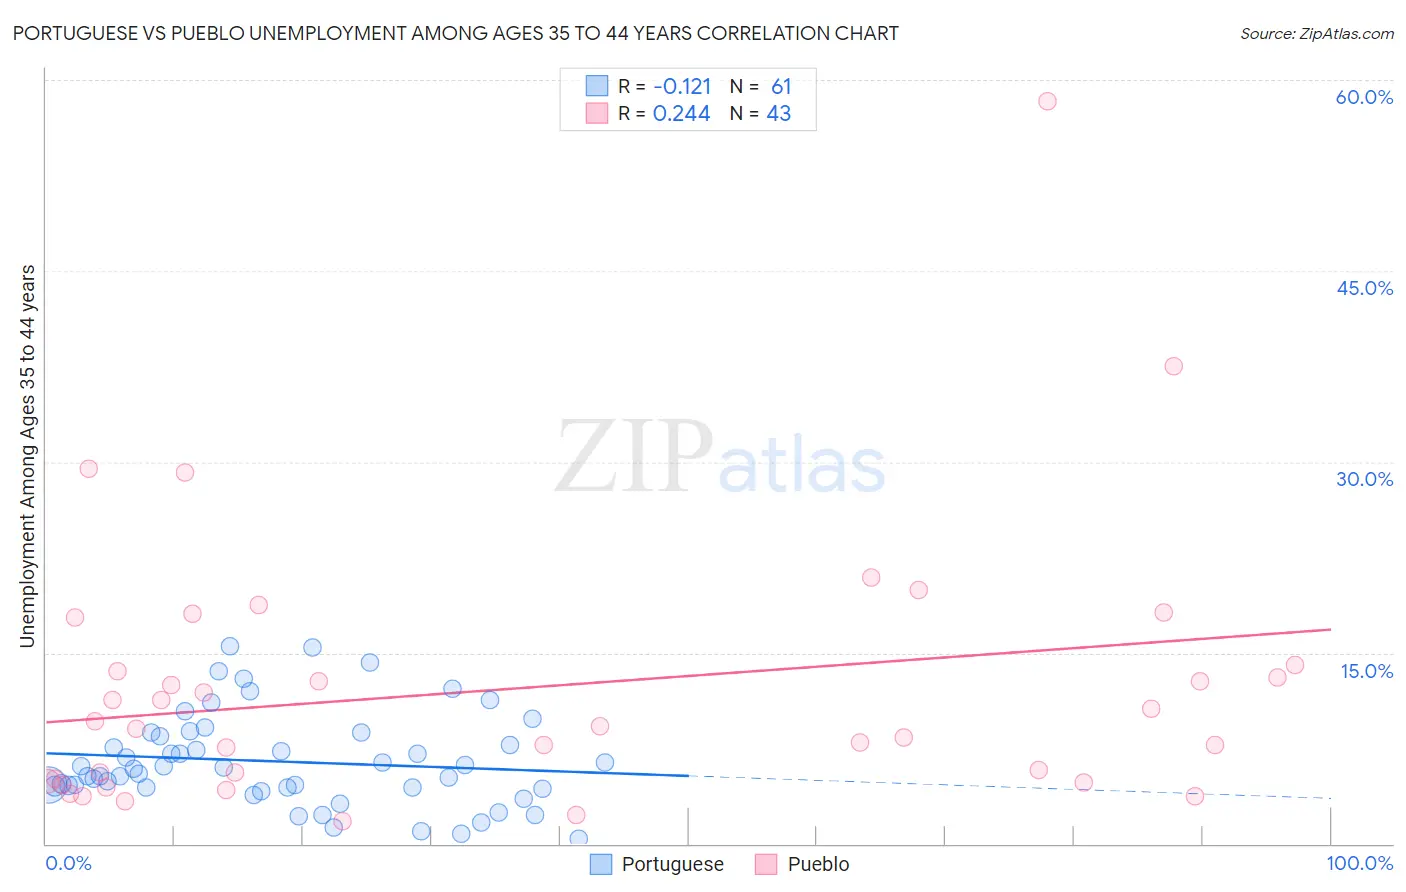
Portuguese vs Pueblo Unemployment Among Ages 35 to 44 years Correlation Chart
The statistical analysis conducted on geographies consisting of 435,170,607 people shows a poor negative correlation between the proportion of Portuguese and unemployment rate among population between the ages 35 and 44 in the United States with a correlation coefficient (R) of -0.121 and weighted average of 5.1%. Similarly, the statistical analysis conducted on geographies consisting of 119,202,461 people shows a weak positive correlation between the proportion of Pueblo and unemployment rate among population between the ages 35 and 44 in the United States with a correlation coefficient (R) of 0.244 and weighted average of 7.1%, a difference of 39.3%.
Unemployment Among Ages 35 to 44 years Correlation Summary
| Measurement | Portuguese | Pueblo |
| Minimum | 0.40% | 1.8% |
| Maximum | 15.5% | 58.3% |
| Range | 15.1% | 56.5% |
| Mean | 6.5% | 12.2% |
| Median | 5.9% | 9.2% |
| Interquartile 25% (IQ1) | 4.4% | 4.9% |
| Interquartile 75% (IQ3) | 8.6% | 14.0% |
| Interquartile Range (IQR) | 4.2% | 9.1% |
| Standard Deviation (Sample) | 3.6% | 10.6% |
| Standard Deviation (Population) | 3.6% | 10.5% |
Similar Demographics by Unemployment Among Ages 35 to 44 years
Demographics Similar to Portuguese by Unemployment Among Ages 35 to 44 years
In terms of unemployment among ages 35 to 44 years, the demographic groups most similar to Portuguese are Immigrants from Nigeria (5.1%, a difference of 0.060%), Iroquois (5.1%, a difference of 0.11%), Japanese (5.1%, a difference of 0.19%), Liberian (5.1%, a difference of 0.22%), and Guamanian/Chamorro (5.1%, a difference of 0.26%).
| Demographics | Rating | Rank | Unemployment Among Ages 35 to 44 years |
| Immigrants | Uzbekistan | 1.9 /100 | #227 | Tragic 5.0% |
| Samoans | 1.8 /100 | #228 | Tragic 5.0% |
| Immigrants | Cambodia | 1.5 /100 | #229 | Tragic 5.0% |
| Liberians | 1.3 /100 | #230 | Tragic 5.1% |
| Japanese | 1.2 /100 | #231 | Tragic 5.1% |
| Iroquois | 1.2 /100 | #232 | Tragic 5.1% |
| Immigrants | Nigeria | 1.2 /100 | #233 | Tragic 5.1% |
| Portuguese | 1.1 /100 | #234 | Tragic 5.1% |
| Guamanians/Chamorros | 0.9 /100 | #235 | Tragic 5.1% |
| Central Americans | 0.8 /100 | #236 | Tragic 5.1% |
| Kiowa | 0.8 /100 | #237 | Tragic 5.1% |
| Hondurans | 0.7 /100 | #238 | Tragic 5.1% |
| Nigerians | 0.7 /100 | #239 | Tragic 5.1% |
| Somalis | 0.7 /100 | #240 | Tragic 5.1% |
| Immigrants | Honduras | 0.6 /100 | #241 | Tragic 5.1% |
Demographics Similar to Pueblo by Unemployment Among Ages 35 to 44 years
In terms of unemployment among ages 35 to 44 years, the demographic groups most similar to Pueblo are Immigrants from Cabo Verde (6.9%, a difference of 2.5%), Paiute (6.9%, a difference of 2.5%), Native/Alaskan (7.3%, a difference of 2.9%), Shoshone (6.6%, a difference of 6.7%), and Cape Verdean (6.6%, a difference of 7.4%).
| Demographics | Rating | Rank | Unemployment Among Ages 35 to 44 years |
| Menominee | 0.0 /100 | #324 | Tragic 6.5% |
| Immigrants | Yemen | 0.0 /100 | #325 | Tragic 6.6% |
| Alaska Natives | 0.0 /100 | #326 | Tragic 6.6% |
| Cape Verdeans | 0.0 /100 | #327 | Tragic 6.6% |
| Shoshone | 0.0 /100 | #328 | Tragic 6.6% |
| Paiute | 0.0 /100 | #329 | Tragic 6.9% |
| Immigrants | Cabo Verde | 0.0 /100 | #330 | Tragic 6.9% |
| Pueblo | 0.0 /100 | #331 | Tragic 7.1% |
| Natives/Alaskans | 0.0 /100 | #332 | Tragic 7.3% |
| Puerto Ricans | 0.0 /100 | #333 | Tragic 7.6% |
| Houma | 0.0 /100 | #334 | Tragic 7.8% |
| Sioux | 0.0 /100 | #335 | Tragic 8.4% |
| Apache | 0.0 /100 | #336 | Tragic 8.4% |
| Tohono O'odham | 0.0 /100 | #337 | Tragic 8.4% |
| Cheyenne | 0.0 /100 | #338 | Tragic 8.5% |